
Higher June 2022 Paper 3 Q14
14 Students in two classes, A and B, raised money for charity.
The box plot for class A is shown on the grid.
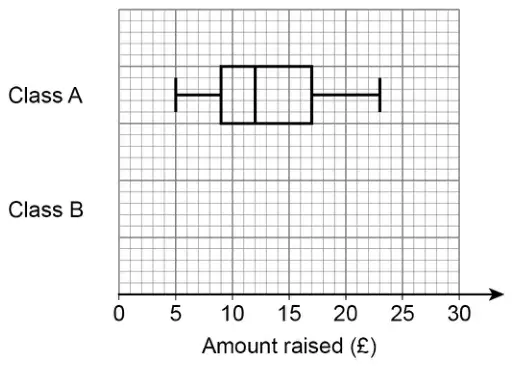
For class B,
- the lowest amount was £3 and the highest amount was £26
- the lower quartile was £11
- the median was £2 greater than the class A median
- the interquartile range was \(1\dfrac{1}{2}\) times greater than the class A interquartile range.
Draw the box plot for class B on the grid. [4 marks]
| Answer | Mark | Comments |
|---|---|---|
| Rectangular boxplot with whiskers to 3 and 26 | B1 | must have a rectangular box with whiskers |
| Lower quartile at 11 | B1 | must be first vertical line of a box with three vertical lines |
| Median at 14 | B1 | must be second vertical line of a box with three vertical lines |
| Upper quartile at 23 | B1ft | ft their LQ + 12 must be vertical line at right side of their box |
Additional guidance
Correct boxplot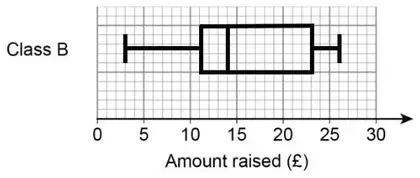 | |
| Mark intention eg any height and allow horizontal line through centre of box | |
| Allow ends of whiskers to be vertical lines of any length, dots, crosses or missing | |
| \(\pm\dfrac{1}{2}\) small square tolerance | |
| Only vertical lines or points plotted | B0 |