
Higher June 2022 Paper 2 Q14
14 A survey was held in a football stadium.
A sample of the crowd was asked about the importance of a family area.
The pie chart represents the answers.
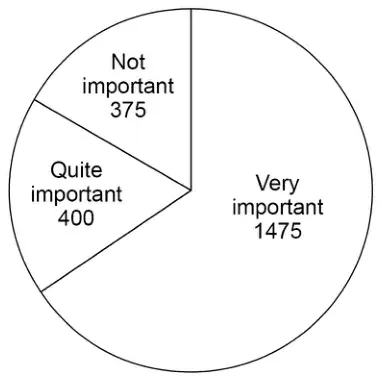
(a) The total number of people in the crowd was 29 250
Estimate how many people in the crowd think that a family area is very important.
Assume that the sample is representative of the crowd. [3 marks]
(b) In fact,
- 50% of the sample were sitting in the family area
- 10% of the crowd were sitting in the family area.
What is this likely to mean about the actual number of people in the crowd who think that a family area is very important?
Tick one box. [1 mark]
- It is larger than the answer to part (a)
- It is the same as the answer to part (a)
- It is lower than the answer to part (a)
| Answer | Mark | Comments |
|---|---|---|
| Alternative method 1 | ||
| \(375 + 400 + 1475\) or 2250 or 13 seen or \(\dfrac{59}{90}\) seen or [0.65, 0.66] seen | M1 | oe for 375 allow 350 or 370 or 380 or 400 for 1475 allow 1450 or 1470 or 1480 or 1500 eg \(400 + 400 + 1500\) any estimated values must be seen eg only seeing 2300 is M0 |
| \(\dfrac{1475}{375 + 400 + 1475} \times 29\,250\) or \(1475 \times 13\) or [0.65, 0.66] \(\times\) 29 250 or [19012.5, 19305] | M1dep | oe for 375 allow 350 or 370 or 380 or 400 for 1475 allow 1450 or 1470 or 1480 or 1500 for 29 250 allow 29 000 or 29 200 or 29 300 or 29 500 or 30 000 |
| 19 175 | A1 | |
| Alternative method 2 | ||
| [234, 238] | M1 | may be on the diagram |
| \(\dfrac{\text{their } [234, 238]}{360} \times 29\,250\) or their [234, 238] \(\times\) 81.25 | M1dep | oe for 29 250 allow 29 000 or 29 200 or 29 300 or 29 500 or 30 000 |
| 19 175 | A1 | |
Additional guidance
| \(375 + 400 + 1475 = 2250\) If they subsequently estimate 2250 no further marks can be scored | M1 |
| Answer 19 175 is M1M1A1 unless it comes from rounding or truncating | |
| eg1 Alt 1 \(0.65555 \times 29\,250 = 19\,175\) | M1M1A1 |
| eg2 Alt 1 \(0.65555 \times 29\,250 = 19\,174.8\) Answer 19 175 | M1M1A0 |
| Alt 2 if their angle is outside the range [234, 238] | M0M0A0 |
| Answer | Mark | Comments |
|---|---|---|
| It is lower than the answer to part (a) | B1 |