
Foundation November 2022 Paper 3 Q21
21 The scatter graph shows the height and mass of some dogs.
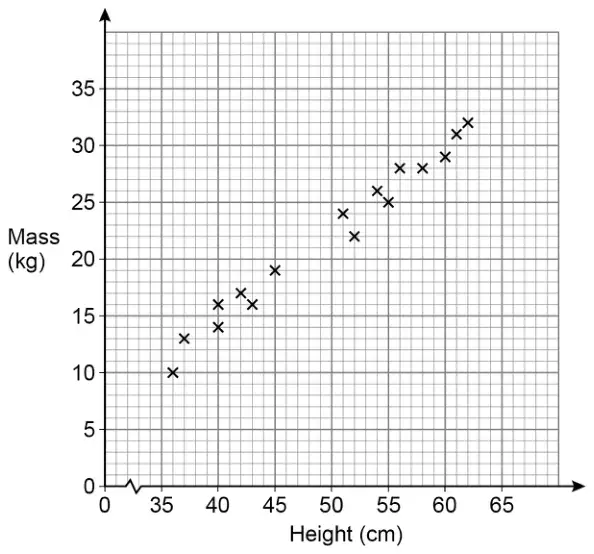
(a) The scatter graph shows positive correlation.
Describe the relationship between the height and mass of the dogs. [1 mark]
(b) Use a line of best fit to estimate the mass of a dog with height 48 cm [2 marks]
| Answer | Mark | Comments |
|---|---|---|
| Valid description | B1 | eg as height increases so does mass or as mass decreases so does height |
Additional guidance
| Ignore incorrect or irrelevant statements alongside correct statements, unless contradictory | |
| As one increases so does the other | B1 |
| It is usually heavier the taller it is | B1 |
| As height increases the weight increases | B1 |
| They are directly proportional (condone) | B1 |
| It is positive correlation because the taller the dogs the heavier the dogs | B1 |
| The taller they are the more they weigh | B1 |
| Taller dogs are heavier | B1 |
| The tallest dogs have more mass than the shorter dogs | B1 |
| The shortest dogs have a lower mass | B1 |
| Mass and height both increase at the same time (condone) | B1 |
| The height and mass of the dogs increase at the same rate (condone) | B1 |
| A tall dog is heavy | B0 |
| The bigger they are the more they weigh (height is not implied from bigger) | B0 |
| It is heavier as it grows (height is not implied from growth) | B0 |
| It is positive correlation | B0 |
| Answer | Mark | Comments |
|---|---|---|
| Straight line passing through (36, [9, 13]) and (62, [30, 34]) | B1 | accept intention to draw a straight line ignore anything outside (36, [9, 13]) and (62, [30, 34]) |
| Correct reading \(\pm\dfrac{1}{2}\) square for their straight line | B1ft | ft their line with positive gradient ignore any working lines on their graph |
Additional guidance
| No line of best fit | B0B0 |
| Short straight line not passing through (36, [9, 13]) and (62, [30, 34]) with positive gradient and correct reading \(\pm\dfrac{1}{2}\) square for their line | B0B1ft |
| Two lines of best fit, mark the line that leads to their answer | |
| Two lines of best fit, no answer, apply the usual rules of choice |