The \(x\)-values in the table make a linear sequence.
The \(y\)-values in the table make a different linear sequence.
(a) Complete the table. [2 marks]
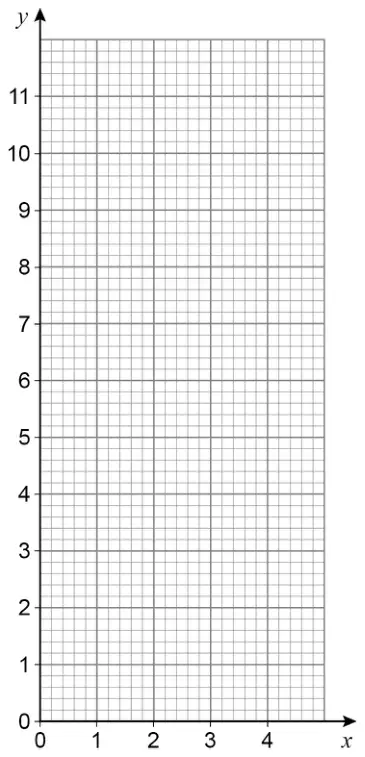
(b) Draw a straight line passing through the points (0, 3), (2, 7) and (4, 11) [2 marks]
(c) Use the graph to work out the value of \(y\) when \(\;x = 3\) [1 mark]
Mark scheme (a)
Answer
Mark
Comments
\((x =)\) 10 and \((y =)\) 15
B2
B1 \((x =)\) 10 or \((y =)\) 15
Additional guidance
\(x\)
0
2
4
6
8
10
\(y\)
3
7
11
15
19
23
B2
Mark scheme (b)
Answer
Mark
Comments
Straight line from (0, 3) to (4, 11)
B2
B1 at least two of (0, 3), (2, 7) and (4, 11) plotted or straight line from (0, 3) to (2, 7) or straight line from (2, 7) to (4, 11) \(\pm\dfrac{1}{2}\) square
Additional guidance
B2 or B1 may be awarded for a straight line without points plotted
Mark intention
Ignore line drawn after (4, 11)
Two points plotted with the same \(x\)-coordinate is choice unless the line is drawn through one of the points
Mark scheme (c)
Answer
Mark
Comments
9
B1ft
correct or ft their line in (b) \(\pm\dfrac{1}{2}\) square