
Foundation June 2023 Paper 1 Q20
20 Players score points in a game.
The scatter graph shows the time played and the points scored by some players.
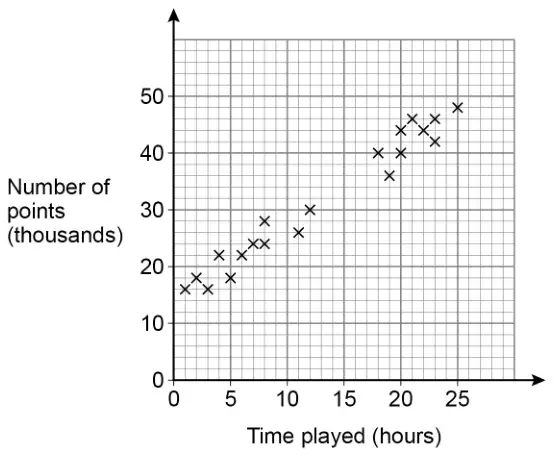
(a) Circle the strength and type of correlation shown. [1 mark]
- weak positive
- strong positive
- weak negative
- strong negative
(b) Players get one extra life for every 2000 points they score.
Jonah plays the game for 15 hours.
Use a line of best fit to estimate the number of extra lives he gets. [3 marks]
| Answer | Mark | Comments |
|---|---|---|
| Strong positive | B1 |
| Answer | Mark | Comments |
|---|---|---|
| Straight line of best fit passing through (5, [18k, 24k]) and (23, [42k, 48k] | B1 | mark intention of straight line ignore anything beyond gates |
| Correct reading \(\pm\dfrac{1}{2}\) square for their straight line of best fit | B1ft | ft their straight line with positive gradient ignore any working lines on the graph condone thousands missing may be implied by correct number of lives for their line |
| Correct evaluation of their answer in thousands divided by 2000 | B1ft | ft their reading from straight line but must be in thousands condone half a life (or rounded or truncated) if reading is an odd number of thousands |
Additional guidance
| (their correct line of best fit would give a reading of 34 000) Answer 17 Answer 0.017 (Points =) 33 000, answer 16 (within half a square, answer truncated) (Points =) 32 000, answer 16 | B1B1B1 B1B1B0 B1B1B1 B1B0B1ft |
| For two lines of best fit with no answer, take as choice |