
Foundation June 2019 Paper 1 Q8
8 A game is played 50 times.
The vertical line chart shows the winning scores.
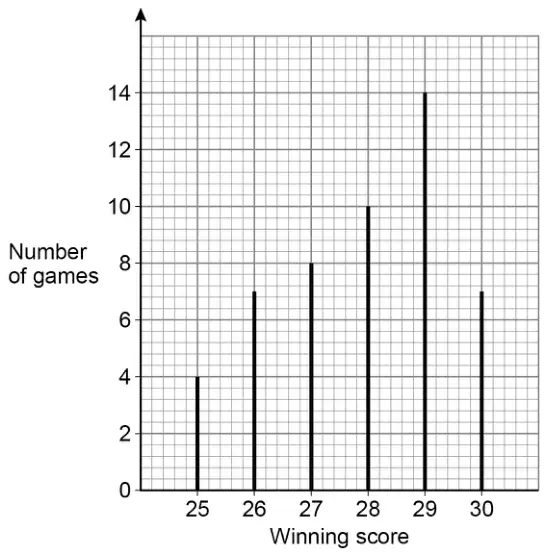
(a) Write down the mode. [1 mark]
The game is played again.
(b) Use the chart to estimate the probability that the winning score is 25 [1 mark]
(c) Use the chart to estimate the probability that the winning score is 27 or more. [2 marks]
| Answer | Mark | Comments |
|---|---|---|
| 29 | B1 |
Additional guidance
Accept words
| Answer | Mark | Comments |
|---|---|---|
| \(\dfrac{4}{50}\) | B1 | oe fraction, decimal or percentage eg \(\dfrac{2}{25} \quad 0.08 \quad 8\%\) |
Additional guidance
| Ignore attempts to simplify or convert a correct fraction | B1 |
| Ignore probability words unless contradictory, eg \(\dfrac{4}{50}\) unlikely | B1 |
| 4 out of 50 or 4 in 50 or 4 : 50 is B0 however, condone 4 out of 50 or 4 in 50 with a correct fraction, decimal or percentage (together on answer line) but do not accept 4 : 50 with a correct fraction, decimal or percentage (together on answer line) | B1 B0 |
| \(\dfrac{4}{50}\) seen, but answer 4 | B0 |
| Answer | Mark | Comments |
|---|---|---|
| \(8 + 10 + 14 + 7\) or \(50 - 4 - 7\) or \(50 - 11\) or 39 | M1 | allow one error (but not omission) in the 4 frequencies being added frequencies may be seen as numerators of fractions (as probabilities) – ignore denominators as long as they are all the same and all probabilities are < 1 in subtraction method, both frequencies must be correct Condone 51 for 50 for M1 |
| \(\dfrac{39}{50}\) | A1 | oe fraction, decimal or percentage eg 0.78 78% |
Additional guidance
| Ignore attempts to simplify or convert a correct fraction | M1A1 |
| \(\dfrac{8}{100} + \dfrac{10}{100} + \dfrac{14}{100} + \dfrac{6.5}{100}\) (frequencies have one error and no omissions, seen as probabilities, with same denominator) | M1A0 |
| \(1 - \dfrac{11}{50}\) or \(1 - \dfrac{7}{50} - \dfrac{4}{50}\) is correct for M1 (allow \(\dfrac{50}{50}\) in place of 1) also accept the above with any consistent denominator eg \(\dfrac{52}{52} - \dfrac{11}{52}\) | at least M1 M1A0 |
| \(\dfrac{39}{50}\) then 39 as final answer | M1A0 |
| 39 out of 50 or 39 in 50 or 39 : 50 is M1A0 however, condone 39 out of 50 or 39 in 50 with a correct fraction, decimal or percentage (together on answer line) but do not accept 39 : 50 with a correct fraction, decimal or percentage (together on answer line) | M1A1 M1A0 |
| Ignore probability words unless contradictory, eg \(\dfrac{39}{50}\) unlikely | M1A0 |
| Numbers may be shown on the diagram but must then be added (or subtracted from 50 as appropriate) to score M1 | |
| \(\dfrac{39}{51}\) (or denominator other than 50) | M1A0 |