
Foundation November 2019 Paper 1 Q6
6 The pictogram shows information about the number of pictures sold in an art shop in each of January, February and March.
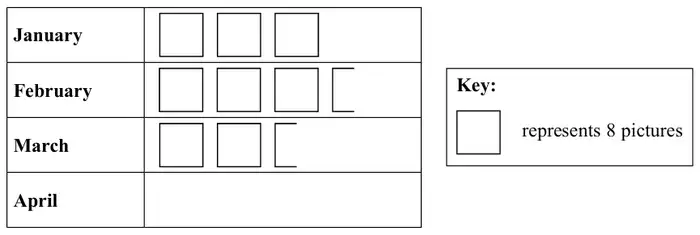
(a) Write down the number of pictures sold in January. (1)
12 pictures were sold in April.
(b) Show this information on the pictogram. (1)
(c) What was the total number of pictures sold in these four months? (2)
| Answer | Mark | Mark scheme |
|---|---|---|
| 24 | B1 | cao |
| Answer | Mark | Mark scheme |
|---|---|---|
 | C1 | for showing diagrams that represent 12 pictorially |
Additional guidance
Shapes can come from a combination of shapes, but must sum to 12. Any orientation.
| Answer | Mark | Mark scheme |
|---|---|---|
| 84 | M1 | for a complete method to find the total number eg \(3 \times 8 + 3.5 \times 8 + 2.5 \times 8 + 12\) or \(\left(3 + 3\frac{1}{2} + 2\frac{1}{2} + 1\frac{1}{2}\right) \times 8\) or \(24 + 28 + 20 + 12\) or \(9 \times 8 + 3 \times 4\) NB ft from (b) |
| A1 | cao |
Additional guidance
Accept one error in the totals for each month, eg \(24 + 28 + 18 + 12\) for the award of this mark.
Do not award for omission of figure for April.
If work in (a) or (b) consistently shows a misinterpretation of the scale the M mark can still be awarded if also consistent