
Foundation June 2019 Paper 2 Q9
9 The pictogram shows information about the number of vinyl records sold in a shop on Monday and on Tuesday.
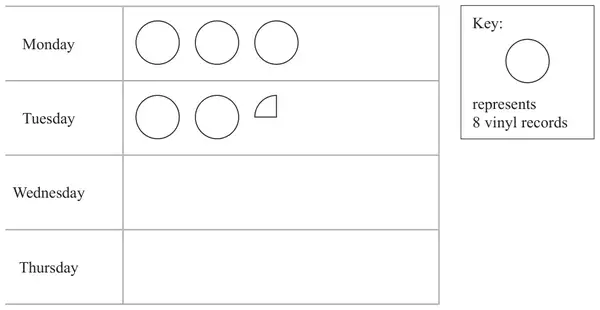
(a) Write down the number of vinyl records sold
(i) on Monday, (1)
(ii) on Tuesday. (1)
On Wednesday and Thursday a total of 36 vinyl records were sold.
The number of records sold on Thursday was 8 times the number of records sold on Wednesday.
(b) Use this information to complete the pictogram. (3)
| Answer | Mark | Mark scheme |
|---|---|---|
| 24 | B1 | cao |
| Answer | Mark | Mark scheme |
|---|---|---|
| 18 | B1 | cao |
| Answer | Mark | Mark scheme |
|---|---|---|
| Diagram | M1 | for \(36 \div 9\) or for using ratio 1 : 8 or setting up \(w + 8w\ (=36)\) |
| A1 | for 4 and 32 | |
| C1 | for correct diagram or ft (dep on M1) for drawing “4” and “32” |
Additional guidance
Fully correct diagram with no method shown gets all 3 marks
SC: B2 for 4 full circles for Wed and half a circle for Thursday
SC: B1 for either Wed correct or for Thurs correct in the diagram if M0 scored