
Higher June 2024 Paper 1 Q6
6 The table shows the number of workers at a company in different years.
| Year | 2015 | 2016 | 2017 | 2018 | 2019 | 2020 | 2021 | 2022 |
|---|---|---|---|---|---|---|---|---|
| Number of workers | 29 | 34 | 42 | 52 | 62 | 70 | 76 | 80 |
A time-series graph is drawn to represent the data.
The first four points have been plotted.
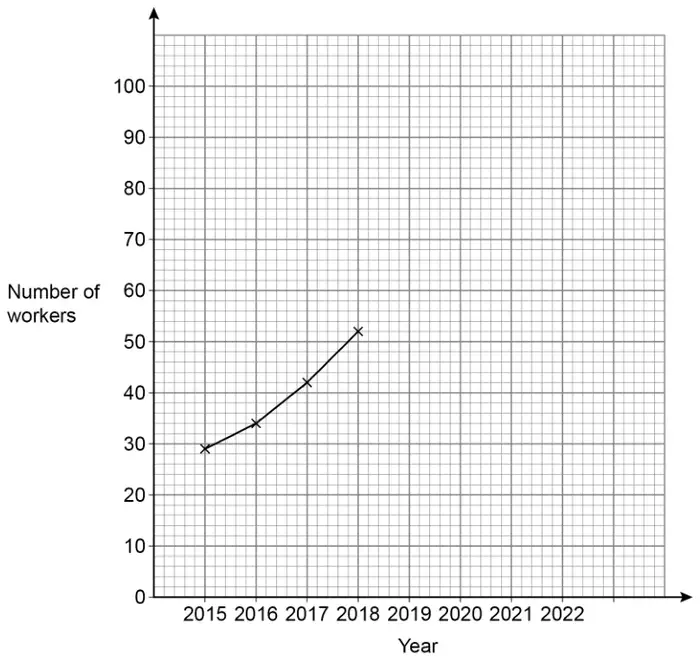
(a) Complete the graph. [2 marks]
(b) Estimate the number of workers at the company in 2023 [1 mark]
| Answer | Mark | Comments |
|---|---|---|
| At least 3 points correctly plotted | M1 | \(\pm\dfrac{1}{2}\) square |
| All 4 points correctly plotted and joined with straight lines | A1 | \(\pm\dfrac{1}{2}\) square lines may be dashed |
Additional guidance
Mark intention for straight lines
Condone one continuous, smooth curve
Ignore the graph before 2015 and after 2022
Ignore a line of best fit
| Answer | Mark | Comments |
|---|---|---|
| [82, 90] | B1 |
Additional guidance
| Answer in range with or without working, with no graph or incorrect graph | B1 |