
Foundation November 2021 Paper 1 Q8
8 Grace recorded the eye colour of each of the students in her class.
The frequency table below shows her results.
| Eye colour | Frequency |
|---|---|
| blue | 10 |
| brown | 15 |
| green | 4 |
Grace then drew the bar chart below for this information.
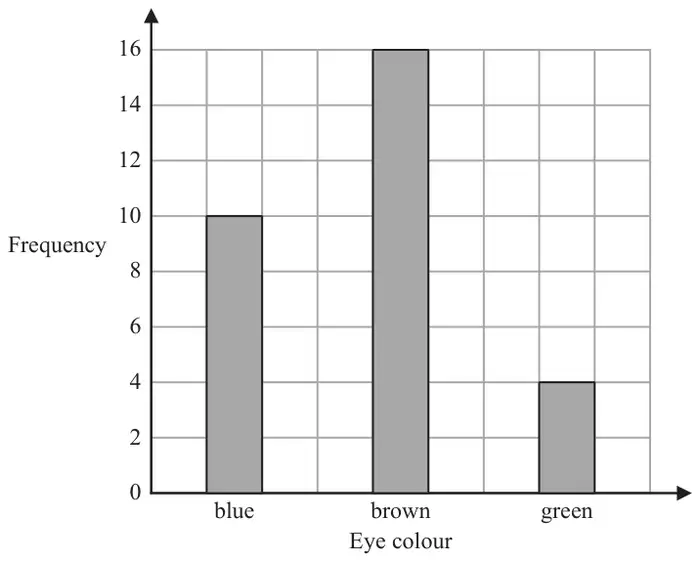
Write down one thing that is wrong with this bar chart. (1)
| Answer | Mark | Mark scheme |
|---|---|---|
| Error identified | C1 | error correctly identified Acceptable examples bar for brown is too high 16 should be 15 brown needs to be one less brown is wrong the graph does not match the table Not acceptable examples no title the gaps between the bars are wrong |