
Foundation June 2022 Paper 2 Q9
9 The graph shows information about the number of houses sold by an estate agent in each of six months last year.
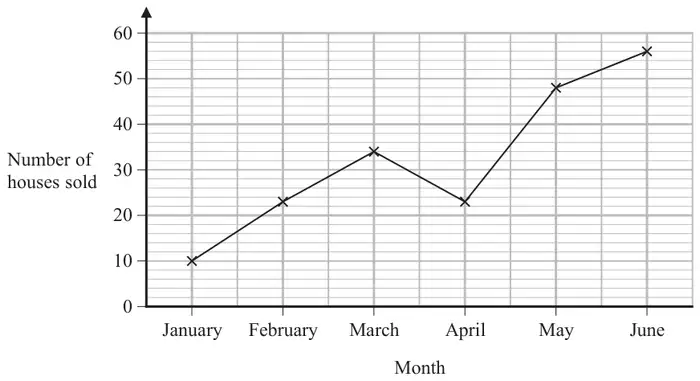
(a) How many houses were sold by the estate agent in February? (1)
(b) For this estate agent, write down the ratio of the number of houses sold in January to the number of houses sold in June. (2)
| Answer | Mark | Mark scheme |
|---|---|---|
| 23 | B1 | cao |
| Answer | Mark | Mark scheme |
|---|---|---|
| 10 : 56 | M1 | for 10 or 56 identified |
| A1 | for 10 : 56 or any other equivalent ratio |
Additional guidance
56 : 10 implies this mark only
Accept 1 : 5.6