
Foundation November 2022 Paper 2 Q18
18 The scatter graph shows information about the amount of rainfall, in mm, and the number of hours of sunshine for each of ten English towns on the same day.
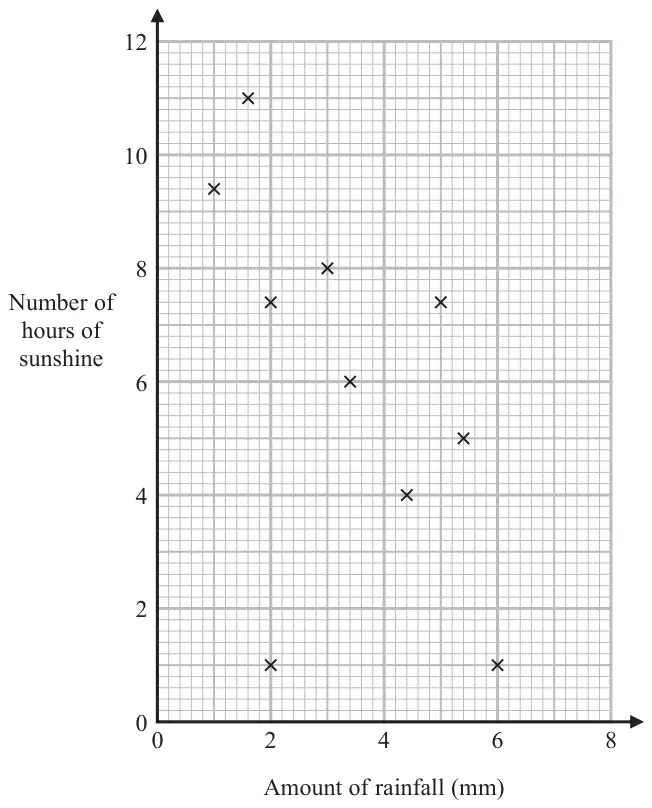
One of the points is an outlier.
(a) Write down the coordinates of this point. (1)
(b) Ignoring the outlier, describe the relationship between the amount of rainfall and the number of hours of sunshine. (1)
On the same day in another English town there were 7 hours of sunshine.
(c) Using the scatter graph, estimate the amount of rainfall in this town on this day. (2)
| Answer | Mark | Mark scheme |
|---|---|---|
| (2, 1) | B1 | cao |
| Answer | Mark | Mark scheme |
|---|---|---|
| Description | C1 | correct description, eg as the amount of rainfall decreases the number of hours of sunshine increases |
Additional guidance
Accept negative correlation
Ignore any comment about strength
Any numbers used in the description must be within tolerance
| Answer | Mark | Mark scheme |
|---|---|---|
| 3 to 4 | M1 | for a suitable line of best fit drawn, or for a point marked at \((x, 7)\), or a horizontal line drawn from 7 across to \((x, 7)\) where \(x\) is in the range 2.5 to 4 |
| A1 | answer in the range 3 to 4 |