The table shows the midday temperature and his sales for five days.
Day 1
Day 2
Day 3
Day 4
Day 5
Temperature (°C)
30
26
17
22
20
Sales (£)
180
150
80
130
120
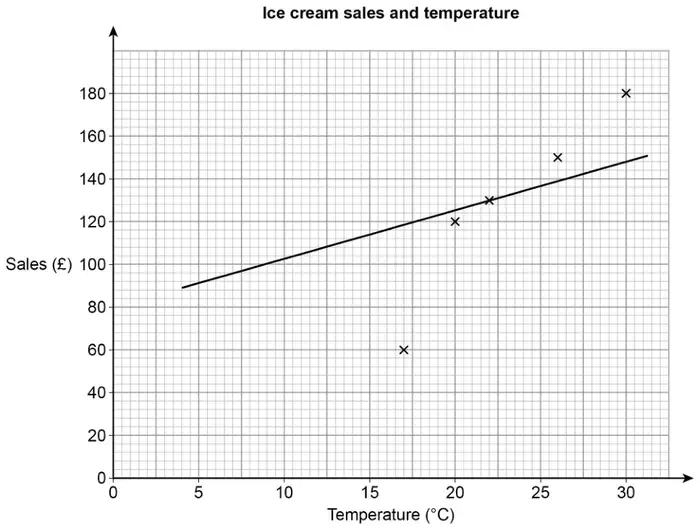
(a) He draws this scatter graph and line of best fit.
Write down two mistakes he has made. [2 marks]
(b) Lee wants to work out the range of the five temperatures.
His calculation is \(\quad 30 - 20 = 10\)
Is his method correct?
Tick a box. [1 mark]
Yes
No
Give a reason to support your answer.
(c) The table shows Lee’s costs.
Ingredients
15% of sales
Fuel
£7 per day
Work out his total profit for the five days. [5 marks]
Mark scheme (a)
Answer
Mark
Comments
Correct criticisms about any two of the incorrect plotting of (17, 80) at (17,60) the incorrect position of the line of best fit the incorrect length of the line of best fit (outside the range of the data)
B2
B1 for one correct comment about point, position or length
Allow reference to a better line of best fit drawn eg The line should look like mine
Additional guidance
A comment about the incorrect point must refer to the specific point
One of the points is wrong and point at (17, 60) circled on graph
B1
Not plotted (17, 80) correctly
B1
x on 60 should be on 80
B1
Point at 60 is wrong
B1
Day 3 is wrong/ there is no day 3 on the graph
B1
17 is plotted at 60/ 17 should be plotted at 80
B1
One of the points is wrong
B0
Points on the graph don’t match the table
B0
Not put all the points in the correct place
B0
A comment about the line of best fit must not have any misconception
The line is not steep enough/ at wrong angle/ should be more vertical
B1
The line isn’t a line of best fit/ the line doesn’t fit the points
B1
The line of best fit goes below 17/ condone past 30 (implies outside range)
B1
The line of best fit is wrong/ not drawn accurately/ not drawn properly
B0
It isn’t a line of best fit because it doesn’t start at 0
B0
The line of best fit is wrong it should go through (0, 0)
B0
The line of best fit doesn’t go through the points
B0
The line is wrong it only goes through one cross
B0
The line of best fit doesn’t go to the axis (implies it’s too short)
B0
Mark scheme (b)
Answer
Mark
Comments
Ticks No and explanation that it should be the highest value – the lowest value
B1
Allow any unambiguous indication of No, if boxes blank may be in the reason oe eg No, it should be the hottest – the coldest
Additional guidance
Does not tick or say No
B0
Ticks No and It should be \(30 - 17\)
B1
Ticks No and It should be 13
B1
Ticks No and He hasn’t subtracted the lowest value
B1
Ticks No and It should be \(17 - 30 = 13\)
B1
Ticks No and Range = biggest – smallest
B1
Ticks No and The lowest temperature is 17 not 20
B1
Ticks No and He hasn’t used the lowest temperature
B1
Ticks No and The lowest temperature is not 20
B1
Ticks No and The lowest temperature is 17
B1
Ticks No and The numbers range from 17 to 30
B1
Ticks No and It should be \(30 - 17 = 23\)
B0
Ticks No and It should be \(17 - 30\)
B0
Ticks No and You should take the smallest from the largest \(30 - 26\)
B0
Ticks No and You should take the smallest from the largest \(180 - 17\)
B0
Ticks No and It should be the smallest – the largest
B0
Ticks Yes and It should be the highest value – the lowest value
B0
Mark scheme (c)
Answer
Mark
Comments
Alternative method 1
\(180 + 150 + 80 + 130 + 120\) or 660
M1
their \(660 \times 0.15\) or 99 or their \(660 \times 0.85\) or 561
M1dep
oe
\(7 \times 5\) or 35
M1
their 660 \(-\) their 99 \(-\) their 35 or their 561 \(-\) their 35
M1dep
dep on M1M1M1
526(.00)
A1
SC4 509
Alternative method 2
\(180 \times 0.15\) or 27 and \(150 \times 0.15\) or 22.5(0) and \(80 \times 0.15\) or 12 and \(130 \times 0.15\) or 19.5(0) and \(120 \times 0.15\) or 18
M1
oe
their 27 \(+\) their 22.5(0) \(+\) their 12 \(+\) their 19.5(0) \(+\) their 18 or 99
M1dep
\(7 \times 5\) or 35
M1
\(180 + 150 + 80 + 130 + 120 -\) their 99 \(-\) their 35
M1dep
dep on M1M1M1
526(.00)
A1
SC4 509
Alternative method 3
\(180 \times 0.15\) or 27 and \(150 \times 0.15\) or 22.5(0) and \(80 \times 0.15\) or 12 and \(130 \times 0.15\) or 19.5(0) and \(120 \times 0.15\) or 18
M1
oe
180 \(-\) their 27 or 153 and 150 \(-\) their 22.5(0) or 127.5(0) and 80 \(-\) their 12 or 68 and 130 \(-\) their 19.5(0) or 110.5(0) and 120 \(-\) their 18 or 102
M1dep
Working out 85% of all five sales scores M1M1dep
\(7 \times 5\) or 35 or their 153 \(-\) 7 or 146 and their 127.5(0) \(-\) 7 or 120.5(0) and their 68 \(-\) 7 or 61 and their 110.5(0) \(-\) 7 or 103.5(0) and their 102 \(-\) 7 or 95
M1
Subtracting five 7s
their 153 \(+\) their 127.5(0) \(+\) their 68 \(+\) their 110.5(0) \(+\) their 102 \(-\) their 35 or their 146 \(+\) their 120.5(0) \(+\) their 61 \(+\) their 103.5(0) \(+\) their 95
M1dep
dep on M1M1M1
526(.00)
A1
SC4 509
Alternative method 4
\(180 \times 0.15\) or 27 and \(150 \times 0.15\) or 22.5(0) and \(80 \times 0.15\) or 12 and \(130 \times 0.15\) or 19.5(0) and \(120 \times 0.15\) or 18
M1
oe
their 27 \(+\) 7 or 34 and their 22.5(0) \(+\) 7 or 29.5(0) and their 12 \(+\) 7 or 19 and their 19.5(0) \(+\) 7 or 26.5(0) and their 18 \(+\) 7 or 25
M1
Adding five 7s
their 34 \(+\) their 29.5(0) \(+\) their 19 \(+\) their 26.5(0) \(+\) their 25 or 134 or 180 \(-\) their 34 or 146 and 150 \(-\) their 29.5(0) or 120.5(0) and 80 \(-\) their 19 or 61 and 130 \(-\) their 26.5(0) or 103.5(0) and 120 \(-\) their 25 or 95
M1dep
dep on M1M1
\(180 + 150 + 80 + 130 + 120 -\) their 134 or their 146 \(+\) their 120.5(0) \(+\) their 61 \(+\) their 103.5(0) \(+\) their 95
M1dep
dep on M1M1M1
526(.00)
A1
SC4 509
Additional guidance
509 comes from using 60 from the incorrect point on the scatter graph
Build up method for 15% must be correct or method shown for incorrect parts eg 10% of 660 = 60, 5% = 30, 15% = 90 eg 10% of 660 = \(660 \div 10\) = 60, 5% = 30, 15% = 90