
Higher June 2017 Paper 3 Q15
15 The graph shows the depth of water in a harbour for 12 hours.
\(d\) is the depth of water in a harbour in metres
\(t\) is the number of hours after 9 am
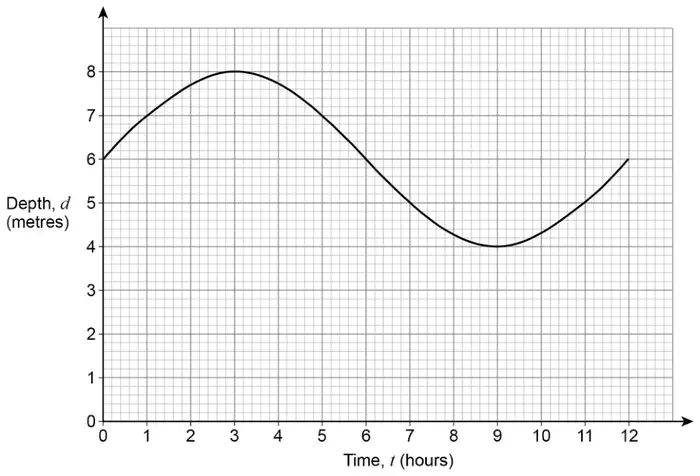
(a) For how many of the 12 hours is the depth more than 5 metres? [1 mark]
(b) By how much does the depth change between 12 noon and 4 pm? [1 mark]
| Answer | Mark | Comments |
|---|---|---|
| 8 | B1 |
| Answer | Mark | Comments |
|---|---|---|
| 3 | B1 | Accept –3 |