
Foundation November 2024 Paper 3 Q5
5 The composite bar chart shows some information about how Calum travelled to school.
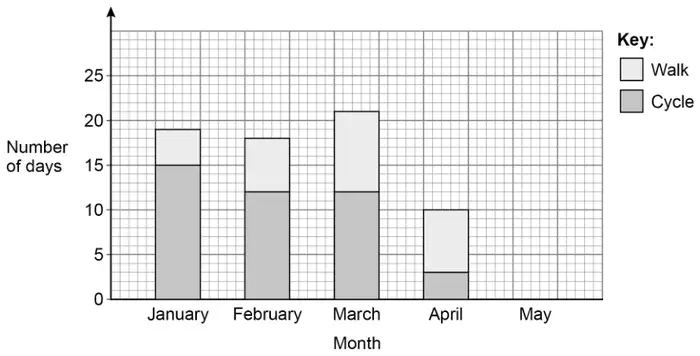
(a) In January, how many days did he walk to school? [1 mark]
(b) In which month did he cycle on twice as many days as he walked? [1 mark]
(c) In May, Calum went to school on 20 days.
He cycled on \(\dfrac{1}{4}\) of the days.
He walked on the other days.
Show this information on the bar chart. [2 marks]
| Answer | Mark | Comments |
|---|---|---|
| 4 | B1 |
| Answer | Mark | Comments |
|---|---|---|
| February | B1 |
Additional guidance
| Accept any indication of February eg Feb | B1 |
| Answer | Mark | Comments |
|---|---|---|
All five of the following criteria
| B2 | B1 horizontal bar split at 5 or (Cycle =) 5 or the following four criteria
|
Additional guidance
Mark intention
Accept Walk bar unshaded
Either shading or labelling correct means shading or labelling criteria is met
For B2, correct shading or labelling must be Cycle at the bottom of the bar and Walk at the top of the bar
For B1, correct shading or labelling must be Cycle at the bottom of the bar and Walk at the top of the bar but not necessarily in a 5 / 15 split
Horizontal bar split at 5 can be indicated by correct shading of bar up to 5
Cycle = 5 may be implied by a bar drawn to 5 or a line at 5