
Foundation November 2024 Paper 2 Q15
15 The graph represents the volume of water in a bath.
The bath is full after 10 minutes.
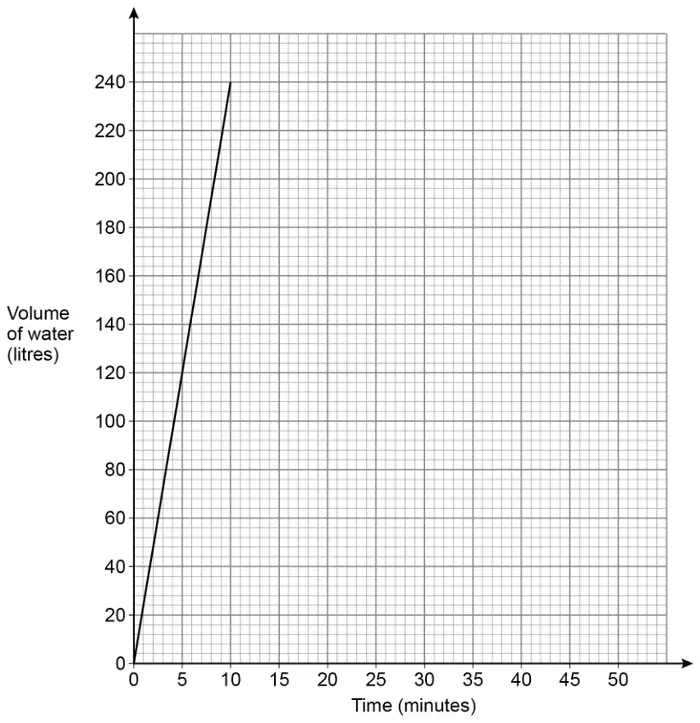
(a) Work out the rate at which the bath is filled.
State the units of your answer. [2 marks]
(b) After the bath is full,
the volume of water stays constant for 20 minutes
then
all the water empties out at a constant rate in 12 minutes.
Show this information on the graph. [2 marks]
| Answer | Mark | Comments |
|---|---|---|
| \(240 \div 10\) or \(120 \div 5\) or 24 or \(240 \times 6\) or \(120 \times 12\) or 1440 | M1 | |
| 24 litres per minute or 1440 litres per hour | A1 | oe eg 24 l/min or 0.4 litres per second |
Additional guidance
| M1 may be awarded for correct work with no answer or incorrect answer, even if this is seen amongst multiple attempts | |
| Units may be abbreviated but must be the correct units for their correct rate eg allow 0.4 l/s or 0.4 lps for 0.4 litres per second | M1A1 |
| Do not ignore further incorrect attempts to change units eg 24 litres per minute and 0.4 litres/hour on the answer line | M1A0 |
| Answer | Mark | Comments |
|---|---|---|
| Horizontal line from (10, 240) to (30, 240) | B1 | \(\pm\dfrac{1}{2}\) small square |
| Straight line from their (30, 240) to (12 + their 30, 0) | B1ft | \(\pm\dfrac{1}{2}\) small square for (12 + their 30, 0) |
Additional guidance
| Mark intention | |
| No horizontal line and straight line from (10, 240) to (22, 0) | B0B1ft |