
Foundation November 2024 Paper 1 Q8
8 The table shows information about where students prefer to revise.
| Library | Home | In class |
|---|---|---|
| 30 | 68 | 37 |
Ed draws this bar chart to represent the data.
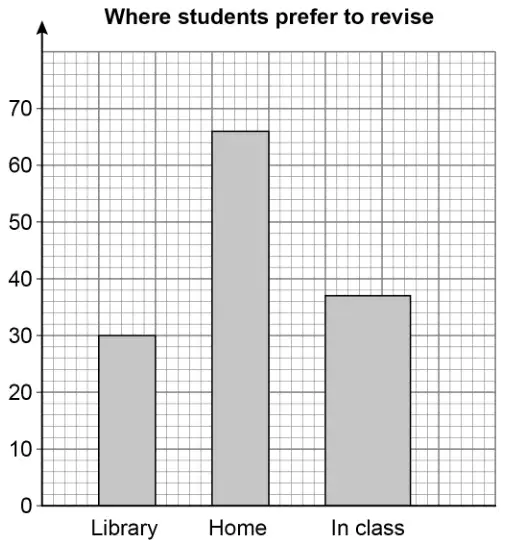
Write down three mistakes he has made. [3 marks]
| Answer | Mark | Comments |
|---|---|---|
Three from:
| B3 | B2 two bullets satisfied B1 one bullet satisfied |
Additional guidance
| Ignore irrelevant but non-contradictory statements | |
| Check diagram for comments | |
| First bullet Number of students label is missing / \(y\)-axis label is missing We don’t know what the 0 10 20 stand for No frequency (label) or No label on the side | B1 B1 B1 |
| Second bullet No label for where students prefer to revise \(x\)-axis label missing or No label at the bottom | B1 B1 |
| Third bullet Bars not equal widths or Two bars are 5 wide and one bar is 7.5 wide Third bar wrong size, it’s too wide/thick Third bar wrong or Third bar wrong size Third bar too big / double the width Bars are different sizes | B1 B1 B0 B0 B0 |
| Fourth bullet Second bar should be (one square) higher/taller Total should be 135 but chart is 133 Second bar is 66 or Second bar should be 68 Second bar is 63 but should be 68 Data for Home is wrong | B1 B1 B1 B0 B0 |
| Two marks may be scored in one sentence eg Home bar too short and In Class too wide | B2 |
| No vertical label and no horizontal label No label(s) / Hasn’t labelled the chart | B2 B1 |
| Three valid mistakes with one or more invalid mistakes | B2 |