
June 2018 Paper 1 Q15
15.
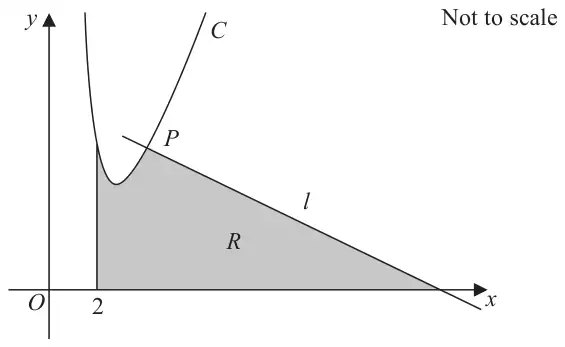
Figure 4 shows a sketch of part of the curve \(C\) with equation
\[y = \frac{32}{x^2} + 3x - 8, \qquad x \gt 0\]The point \(P\,(4, 6)\) lies on \(C\).
The line \(l\) is the normal to \(C\) at the point \(P\).
The region \(R\), shown shaded in Figure 4, is bounded by the line \(l\), the curve \(C\), the line with equation \(x = 2\) and the \(x\)-axis.
Show that the area of \(R\) is 46
(Solutions based entirely on graphical or numerical methods are not acceptable.) (10)
| Scheme | Marks | AO |
|---|---|---|
For the complete strategy of finding where the normal cuts the \(x\)-axis. Key points that must be seen are
| M1 | 3.1a |
| \(y = \dfrac{32}{x^2} + 3x - 8 \Rightarrow \dfrac{\mathrm{d}y}{\mathrm{d}x} = -\dfrac{64}{x^3} + 3\) | M1 A1 | 1.1b 1.1b |
| For a correct method of attempting to find Either the equation of the normal: this requires substituting \(x = 4\) in their \(\dfrac{\mathrm{d}y}{\mathrm{d}x} = -\dfrac{64}{x^3} + 3 = (2)\), then using the perpendicular gradient rule to find the equation of normal \(y - 6 = \text{``}{-\dfrac{1}{2}}\text{''}(x - 4)\) Or where the equation of the normal at (4,6) cuts the \(x\) - axis. As above but may not see equation of normal. Eg \(0 - 6 = \text{``}{-\dfrac{1}{2}}\text{''}(x - 4) \Rightarrow x = \ldots\) or an attempt using just gradients \(\text{``}{-\dfrac{1}{2}}\text{''} = \dfrac{6}{a - 4} \Rightarrow a = \ldots\) | dM1 | 2.1 |
| Normal cuts the \(x\)-axis at \(x = 16\) | A1 | 1.1b |
For the complete strategy of finding the values of the two key areas. Points that must be seen are
| M1 | 3.1a |
| \(\displaystyle\int \frac{32}{x^2} + 3x - 8\,\mathrm{d}x = -\frac{32}{x} + \frac{3}{2}x^2 - 8x\) | M1 A1 | 1.1b 1.1b |
| Area under curve \(= \left[-\dfrac{32}{x} + \dfrac{3}{2}x^2 - 8x\right]_2^4 = (-16) - (-26) = (10)\) | dM1 | 1.1b |
| Total area \(= 10 + 36 = 46\) * | A1* | 2.1 |
| (10) | ||
| (10 marks) |
Notes
The first 5 marks are for finding the normal to the curve cuts the \(x\) - axis
M1: For the complete strategy of finding where the normal cuts the \(x\)- axis. See scheme
M1: Differentiates with at least one index reduced by one
A1: \(\dfrac{\mathrm{d}y}{\mathrm{d}x} = -\dfrac{64}{x^3} + 3\)
dM1: Method of finding
either the equation of the normal at (4, 6).
or where the equation of the normal at (4, 6) cuts the \(x\) - axis
See scheme. It is dependent upon having gained the M mark for differentiation.
A1: Normal cuts the \(x\)-axis at \(x = 16\)
The next 5 marks are for finding the area \(R\)
M1: For the complete strategy of finding the values of two key areas. See scheme
M1: Integrates \(\displaystyle\int \frac{32}{x^2} + 3x - 8\,\mathrm{d}x\) raising the power of at least one index
A1: \(\displaystyle\int \frac{32}{x^2} + 3x - 8\,\mathrm{d}x = -\frac{32}{x} + \frac{3}{2}x^2 - 8x\) which may be unsimplified
dM1: Area \(= \left[-\dfrac{32}{x} + \dfrac{3}{2}x^2 - 8x\right]_2^4 = (-16) - (-26) = (10)\)
It is dependent upon having scored the M mark for integration, for substituting in both 4 and 2 and subtracting either way around. The above line shows the minimum allowed working for a correct answer.
A1*: Shows that the area under curve = 46. No errors or omissions are allowed
Alternative
A number of candidates are equating the line and the curve (or subtracting the line from the curve) The last 5 marks are scored as follows.
M1: For the complete strategy of finding the values of the two key areas. Points that must be seen are
- There must be an attempt to find the area BETWEEN the line and the curve either way around by integrating between 2 and 4
- There must be an attempt to find the area of a triangle using \(\dfrac{1}{2} \times (\text{‘}16\text{’} - 2) \times \left(-\dfrac{1}{2} \times 2 + 8\right)\) or via integration \(\displaystyle\int_2^{16} \left(\text{``}{-\dfrac{1}{2}x + 8}\text{''}\right)\mathrm{d}x\)
M1: Integrates \(\displaystyle\int \left(\text{``}{-\dfrac{1}{2}x + 8}\text{''}\right) - \left(\dfrac{32}{x^2} + 3x - 8\right)\mathrm{d}x\) either way around and raises the power of at least one index by one
A1: \(\pm\left(-\dfrac{32}{x} + \dfrac{7}{4}x^2 - 16x\right)\) must be correct
dM1: Area \(= \displaystyle\int_2^4 \left(\text{``}{-\dfrac{1}{2}x + 8}\text{''}\right) - \left(\dfrac{32}{x^2} + 3x - 8\right)\mathrm{d}x = \ldots\ldots\) either way around
A1: Area \(= 49 - 3 = 46\)
NB: Watch for candidates who calculate the area under the curve between 2 and 4 = 10 and subtract this from the large triangle = 56. They will lose both the strategy mark and the answer mark.
NB. Watch for students who use their calculators to do the majority of the work. Please send these items to review