
A2 June 2025 Q4
4.
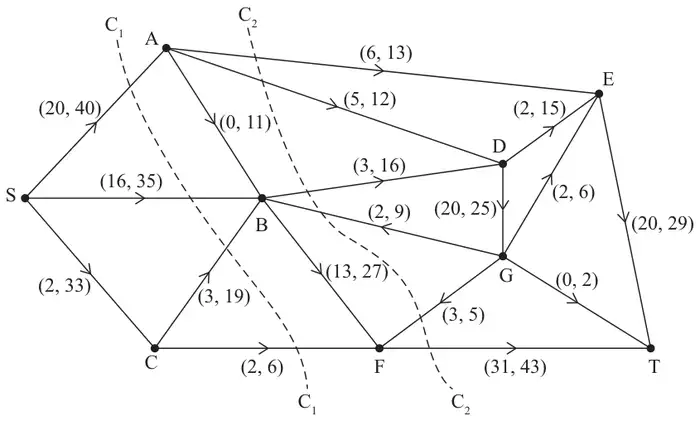
Figure 2 shows a capacitated, directed network. The network represents a system of pipes through which fluid can flow.
The weights on the arcs show the lower and upper capacities for the corresponding pipes, in litres per second.
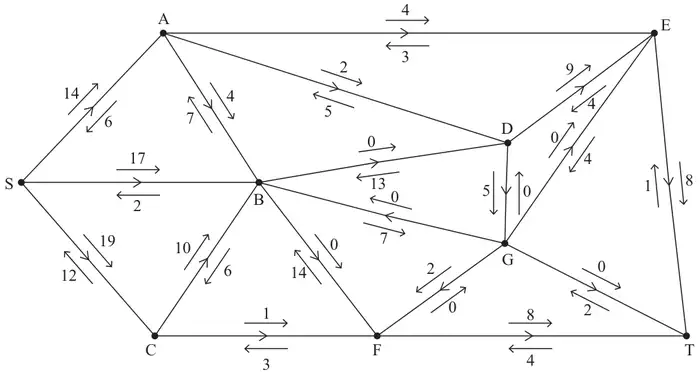
A scientist monitors the system of pipes in which a fluid now flows from the source, S, to the sink, T.
The scientist initialises the labelling procedure for this system. The excess and potential backflows for this are shown on the arrows either side of each arc in Figure 3.
| Scheme | Marks | AO |
|---|---|---|
| \(C_1\,(= 40 + 35 + 19 + 6) = 100\) | B1 | 1.1b |
| \(C_2\,(= 13 + 12 + 16 - 2 - 3 + 43) = 79\) | B1 | 1.1b |
| (2) |
Notes
B1: CAO
B1: CAO
| Scheme | Marks | AO |
|---|---|---|
| Deduces the maximum possible flow is \(\leqslant 79\) litres per second | B1ft | 2.2a |
| (1) |
Notes
B1ft: deduced from their least value given in (a) - must include ‘less than or equal to’ (oe)
| Scheme | Marks | AO |
|---|---|---|
| Initial flow = 58 | B1 | 1.1b |
| (1) |
Notes
B1: CAO
| Scheme | Marks | AO |
|---|---|---|
| e.g. SAET – 4, SADET – 2, SBGFT – 2, SCFT – 1 | M1 A1 A1 | 1.1b 1.1b 1.1b |
| (3) |
Notes
M1: One flow augmenting route found from S to T
A1: Two correct routes + flow values
A1: CSO – increasing the flow by 9
Note possible flow augmenting routes are only _ADET + 2 _AET + 4 _BGFT + 2 _CFT + 1 where _ represents either S, SB, SC or SCB
(SADGFT + 2 is also valid but this prevents DET being increased)
| Scheme | Marks | AO |
|---|---|---|
e.g.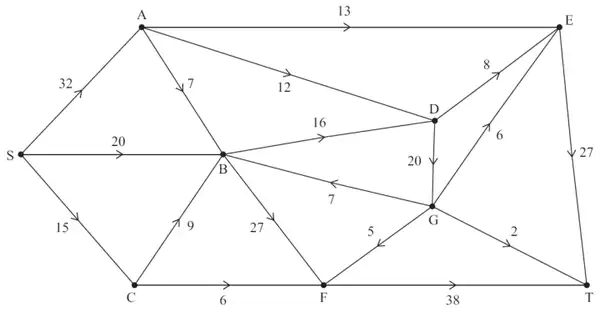 | B1 | 2.2a |
| (1) |
Notes
B1: CAO – one number only per arc (only SA, SB, SC, AB and CB can vary depending on their flow augmenting routes)
| Scheme | Marks | AO |
|---|---|---|
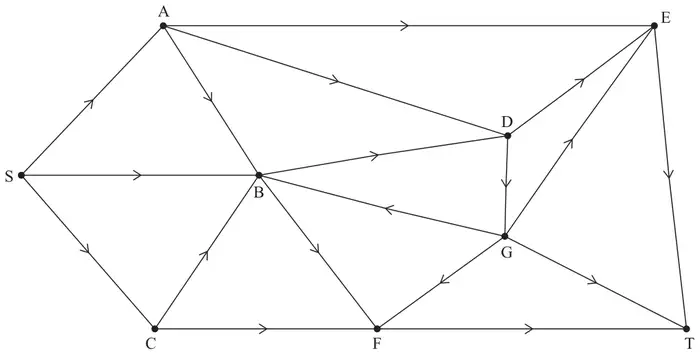
| Use of max-flow min-cut theorem Identification of cut through AE, AD, BD, DG, GE, GT, GF, BF and CF Value of flow = 67 Therefore it follows that flow is maximal | M1 A1 A1 | 2.1 3.1a 2.2a |
| (3) | ||
| (11 marks) |
Notes
M1: Construct argument based on max-flow min-cut theorem (e.g. attempt to find a cut through saturated arcs) (A valid cut through saturated arcs must either be listed or drawn)
May be drawn on either diagram or listed as arcs or set notation {S, A, B, C, G}{D, E, F, T}
A1: Use appropriate process of finding a minimum cut: cut + value correct and value of flow stated
A1: Correct deduction that the flow is maximal – must see all 4 words max flow min cut and conclusion - dependent on previous A mark