
A2 June 2019 Q4
4.
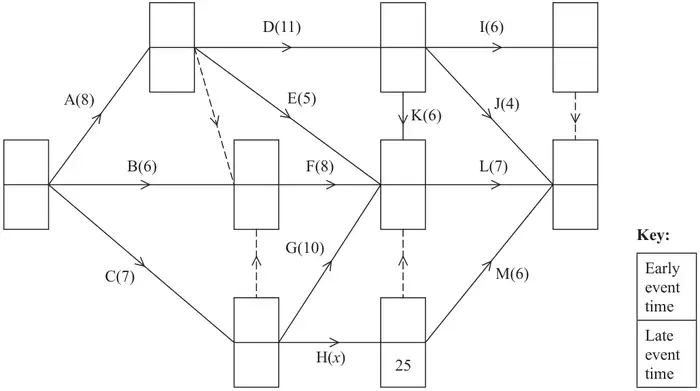
The network in Figure 3 shows the activities that need to be undertaken to complete a project. Each activity is represented by an arc and the duration of the activity, in days, is shown in brackets. The early event times and late event times are to be shown at each vertex and one late event time has been completed for you.
The total float of activity H is 7 days.
[Diagram 1 in the answer book is a copy of Figure 3.]
Each activity requires one worker and the project must be completed in the shortest possible time using as few workers as possible.
| Scheme | Marks | AO |
|---|---|---|
| The early event time at the end of activity C is 7 (as no other activity leads into this event). Therefore the float on activity H is \(25 - 7 - x\) | B1 | 3.1a |
| The float on activity H is given as 7 and so therefore \(25 - 7 - x = 7\) implies that the value of \(x\) is equal to \(25 - 7 - 7 = 11\) | dB1 | 2.4 |
| (2) |
Notes
(a) B1: correct reasoning for why the float on activity H is given by \(25 - 7 - x\), must mention that the early event time at the end of activity C is 7 or the early event time at the start of H is 7 and that the total float for H is therefore \(\underline{25 - 7 - x}\) (or \(25 - x - 7\) but not just \(18 - x\)) (no reason for why the early event time at the end of C is 7 is required)
dB1: correct explanation for why \(x = 11\) (dependent on previous B mark) – as a minimum must equate \(\underline{25 - 7 - x}\) to \(\underline{7}\) (allow \(18 - x = 7\) as they must have shown where the 18 comes from to get the first B mark) and hence \(\underline{x = 11}\)
SC B1B0: – for those who write or imply \(25 - 7 - x = 7\) (but not just \(18 - x = 7\)) and state \(x = 11\) without any mention of the early event time at the end of C or the total float of activity H. However, \(25 - 7 - 7 = 11\) only is no marks in this part
| Scheme | Marks | AO |
|---|---|---|
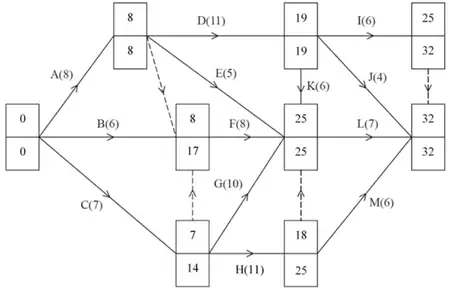 | M1 A1 A1 | 2.1 1.1b 1.1b |
| (3) |
Notes
(b) M1: All top boxes and all bottom boxes completed. Values generally increasing left to right (for top boxes) and values generally decreasing from right to left (for bottom boxes). Condone missing 0s at the source node or the 32 in the bottom box at the sink node for M only. Condone one rogue value in top boxes and one rogue value in bottom boxes. For a rogue in the top boxes if values do not increase in the direction of the arrows then if one value is ignored and then the values do increase in the direction of the arrows then this is considered to be only one rogue value (with a similar definition for bottom boxes but in reverse)
A1: CAO - Top boxes (including zero at the source node)
A1: CAO - Bottom boxes (including zero at the sink node)
| Scheme | Marks | AO |
|---|---|---|
| \(\dfrac{95}{32} = 2.968\ldots = 3\) workers | B1 | 2.2a |
| (1) |
Notes
(c) B1: Correct calculation seen then 3 – an answer of 3 with no working scores B0
| Scheme | Marks | AO |
|---|---|---|
e.g.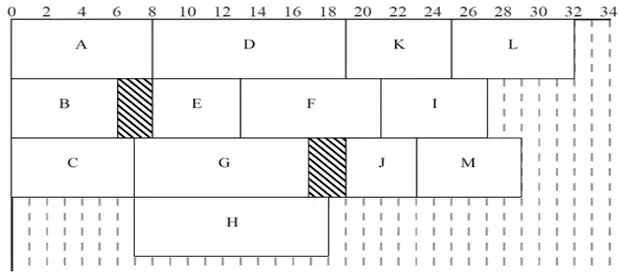 | M1 A1 A1 | 2.1 1.1b 1.1b |
| (3) | ||
| (9 marks) |
Notes
(d) M1: Not a cascade chart. 4 ‘workers’ used at most and at least 10 different activities placed
A1: 4 workers. All 13 activities present (just once – so if an activity appears for two different workers and is happening at the same time this is A0). Condone at most two errors. An activity can give rise to at most three errors; one on duration, one on time interval and only one on IPA
A1: 4 workers. All 13 activities present (just once). No errors
| Activity | Duration | Time interval | IPA |
|---|---|---|---|
| A | 8 | 0 -8 | - |
| B | 6 | 0 – 17 | - |
| C | 7 | 0 – 14 | - |
| D | 11 | 8 – 19 | A |
| E | 5 | 8 – 25 | A |
| F | 8 | 8 – 25 | A, B, C |
| G | 10 | 7 – 25 | C |
| H | 11 | 7 – 25 | C |
| I | 6 | 19 – 32 | D |
| J | 4 | 19 – 32 | D |
| K | 6 | 19 – 25 | D |
| L | 7 | 25 – 32 | E, F, G, H, K |
| M | 6 | 18 – 32 | H |