
A2 June 2022 Q5
5.
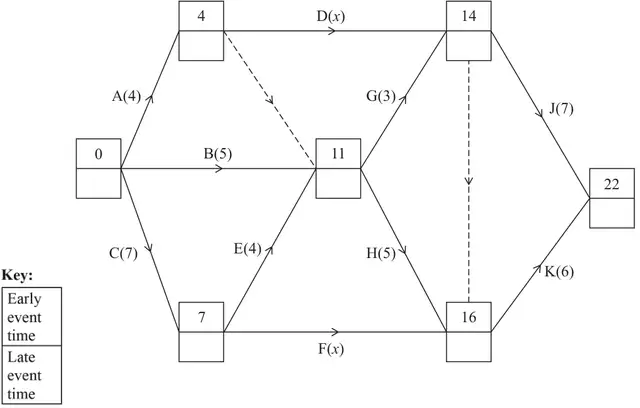
The network in Figure 2 shows the activities that need to be completed for a project. Each activity is represented by an arc and the duration of the activity, in days, is shown in brackets. The early event times are shown in Figure 2.
| Activity | Immediately preceding activity | Activity | Immediately preceding activity |
|---|---|---|---|
| A | F | ||
| B | G | ||
| C | H | ||
| D | J | ||
| E | K |
Table 1
It is given that \(4 \lt x \leqslant m\)
[Diagram 1 in the answer book is a copy of Figure 2.]
The resource histogram in Figure 3 shows the number of workers required when each activity starts at its earliest possible time. The histogram also shows which activities happen at each time.
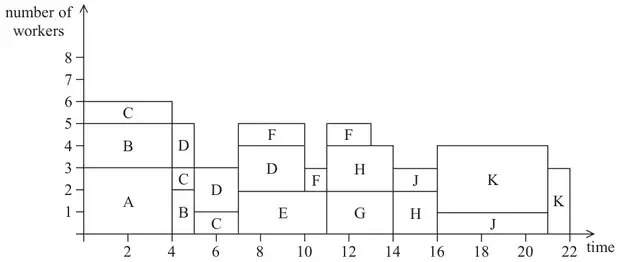
| Activity | Number of workers | Activity | Number of workers |
|---|---|---|---|
| A | F | ||
| B | G | ||
| C | H | ||
| D | J | ||
| E | K |
Table 2
| Scheme | Marks | AO | ||||||||||||||||||||||||
|---|---|---|---|---|---|---|---|---|---|---|---|---|---|---|---|---|---|---|---|---|---|---|---|---|---|---|
| B1 B1 | 1.1b 1.1b | ||||||||||||||||||||||||
| (2) |
Notes
(a) B1: Four correct rows (not including the rows for A, B and C)
B1: All rows correct (accept blanks or dashes (etc.) for A, B and C but any letters placed in these three rows scores B0)
| Scheme | Marks | AO |
|---|---|---|
| \((m =)\ 9\) | B1 | 2.2a |
| (1) |
Notes
(b) B1: cao for the value of \(m\) – allow \(4 \lt x \leqslant 9\) or \(x \leqslant 9\) but not \(x = 9\) or \(m \leqslant 9\) unless stating the correct value too
| Scheme | Marks | AO |
|---|---|---|
(i)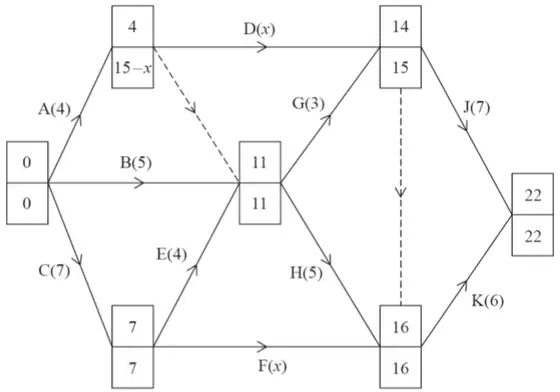 | M1 A1 | 1.1b 1.1b |
| (ii) C, E, H and K must be critical | B1 | 2.2a |
| (3) |
Notes
(c)(i) M1: Any four of the bottom boxes completed correctly
A1: cao – all bottom boxes completed correctly. The \(15 - x\) must be seen to award this mark (but may be crossed out). Condone this correct expression being replaced with their value of \(15 - x\) ONLY if their value of \(x\) is explicitly stated either here or later in their solution
(c)(ii) B1: cao (C, E, H and K only)
| Scheme | Marks | AO |
|---|---|---|
| Total float for activity G is 15 – 11 – 3 = 1 | B1 | 2.2a |
| (1) |
Notes
(d) B1: cao – a correct answer with no working (or no incorrect working) can imply this mark
| Scheme | Marks | AO | ||||||||||||||||||||||||
|---|---|---|---|---|---|---|---|---|---|---|---|---|---|---|---|---|---|---|---|---|---|---|---|---|---|---|
| B1 B1 | 1.1b 1.1b | ||||||||||||||||||||||||
| (2) |
Notes
(e) B1: Any six values correct
B1: cao
| Scheme | Marks | AO |
|---|---|---|
| \(x = 6\) | B1 | 3.1b |
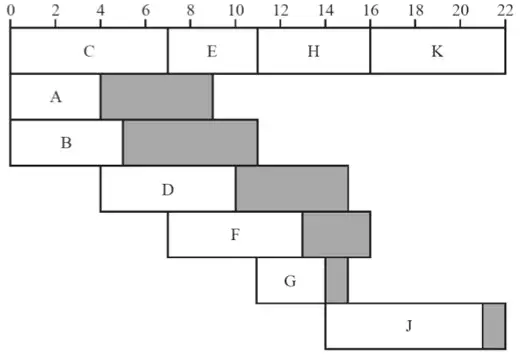 | M1 A1 A1 A1 | 2.1 1.1b 1.1b 1.1b |
| (5) | ||
| (14 marks) |
Notes
(f) B1: cao for the value of \(x\) (seen or implied, e.g., duration of D and F both correct so therefore must be consistent)
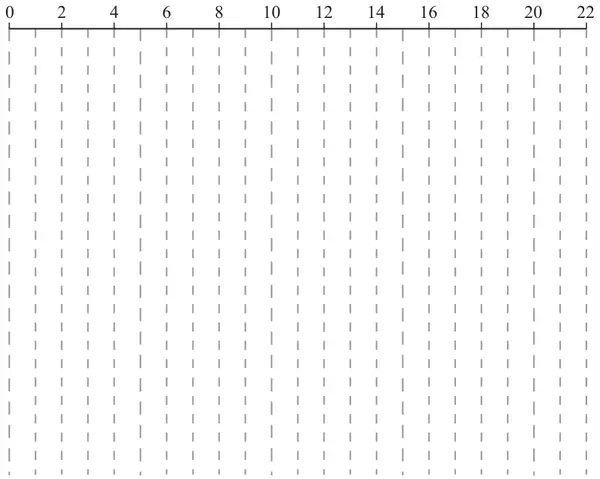
M1: Cascade chart with at least 8 activities labelled and at least four activities having non-zero float. A scheduling diagram (so a diagram in which no floats are evident) scores M0
A1: Critical activities (C, E, H and K) correct
A1: Activities B, G and J correct
A1: Activities A, D and F correct
For (f) the following may be useful in checking their cascade chart provided the float is shown after the corresponding activity:
| Activity | Duration + Float |
|---|---|
| A | 0 to 4 F: 4 to 9 |
| B | 0 to 5 F: 5 to 11 |
| C | 0 to 7 Critical |
| D | 4 to 10 F: 10 to 15 |
| E | 7 to 11 Critical |
| F | 7 to 13 F: 13 to 16 |
| G | 11 to 14 F: 14 to 15 |
| H | 11 to 16 Critical |
| J | 14 to 21 F: 21 to 22 |
| K | 16 to 22 Critical |