
AS June 2023 Q2
2.
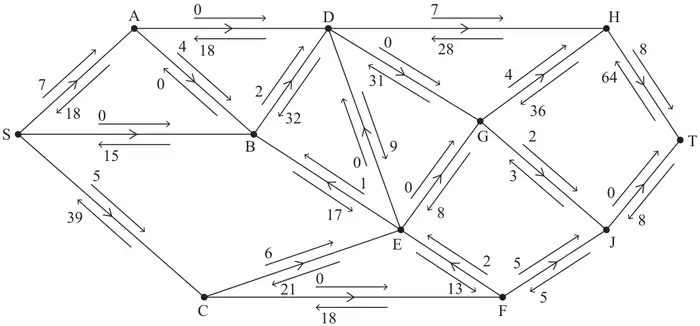
An engineer monitors a system of pipes through which a fluid flows from the source, S, to the sink, T.
The engineer initialises the labelling procedure for this system, and the excess capacities and potential backflows are shown on the arrows either side of each arc, as shown in Figure 1.
| Scheme | Marks | AO |
|---|---|---|
| 72 | B1 | 1.1b |
| (1) |
Notes
B1: cao (72)
| Scheme | Marks | AO |
|---|---|---|
| Value of cut = 25 + 15 + 27 + 15 + 10 = 92 | B1 | 1.1b |
| (1) |
Notes
B1: cao (92)
| Scheme | Marks | AO |
|---|---|---|
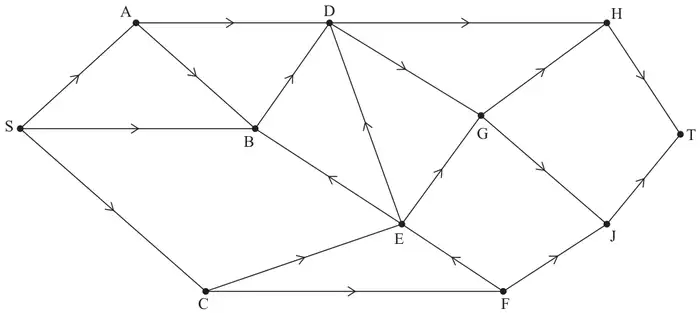
| e.g. SCEFJGHT – 3; SABDHT – 2 SCEFJGHT – 3; SCEBDHT – 1; SABDHT – 1 SABEFJGHT – 3; SABDHT – 2 | M1 A1 A1 | 1.1b 1.1b 1.1b |
| (3) |
Notes
M1: One correct flow augmenting route found from S to T (so any routes that contain SB, BA, AD, CF, ED, EG, DG or JT are incorrect routes) - a ‘correct’ route is one in which the flow through the system can be increased
A1: Two correct routes (ignoring numerical value of the flow for this mark)
A1: cso – increasing the flow by 5 (and no more) – so at least two routes with corresponding correct values stated
| Scheme | Marks | AO |
|---|---|---|
e.g. (based on the first example in (c))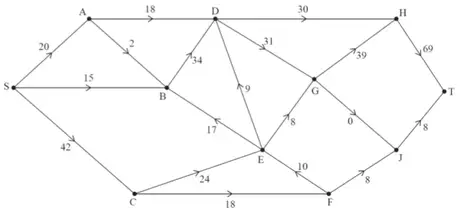 | B1 | 1.1b |
| (1) |
Notes
B1: cao – if there are two numbers on each arc neither of which is circled then B0, if there are two numbers on each arc, one circled and one not, then consider the circled numbers only as the maximum flow pattern. Do not accept a blank arc as a zero
| Scheme | Marks | AO |
|---|---|---|
| Use of max-flow min-cut theorem Identification of cut through AD, BD, ED, EG, GJ and JT Value of flow = 77 Therefore it follows that flow is optimal | M1 A1 A1 | 2.1 3.1a 2.2a |
| (3) | ||
| (9 marks) |
Notes
M1: Construct an argument based on max-flow min-cut theorem (e.g. attempt to find a cut (but not the one through SA, SB, CE, FE, FJ) through saturated arcs – must contain source on one side and sink on the other) – allow cut shown on the Diagram 1 in the answer book – this mark is dependent on an attempt at part (d) (so values on all but two arcs)
A1: Use appropriate process of finding a minimum cut – cut (AD, BD, ED, EG, GJ, JT) and the value of the flow through the network stated correctly (77)
A1: Correct deduction that the flow is maximal – must use all four words ‘maximum’, ‘flow’, ‘minimum’ and ‘cut’ (allow abbreviations for maximum and minimum) – dep on first A mark and the B mark in (d)