
AS October 2020 Q2
2.
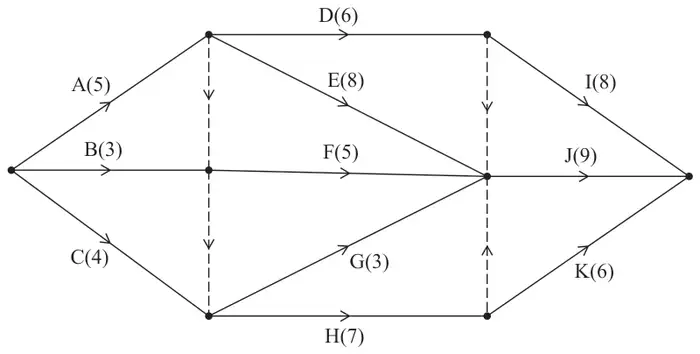
A project is modelled by the activity network shown in Figure 1. The activities are represented by the arcs. The number in brackets on each arc gives the time, in hours, to complete the corresponding activity. Each activity requires one worker. The project is to be completed in the shortest possible time.
| Activity | Immediately preceding activities |
|---|---|
| A | |
| B | |
| C | |
| D | |
| E | |
| F | |
| G | |
| H | |
| I | |
| J | |
| K |
| Scheme | Marks | AO | ||||||||||||||||||||||||
|---|---|---|---|---|---|---|---|---|---|---|---|---|---|---|---|---|---|---|---|---|---|---|---|---|---|---|
| B1 B1 | 1.1b 1.1b | ||||||||||||||||||||||||
| (2) |
Notes
B1: 5 non-empty rows correct (so any 5 of the rows for activities D to K correct)
B1: All 11 rows correct
| Scheme | Marks | AO |
|---|---|---|
 | M1 A1 A1 | 2.1 1.1b 1.1b |
| (3) |
Notes
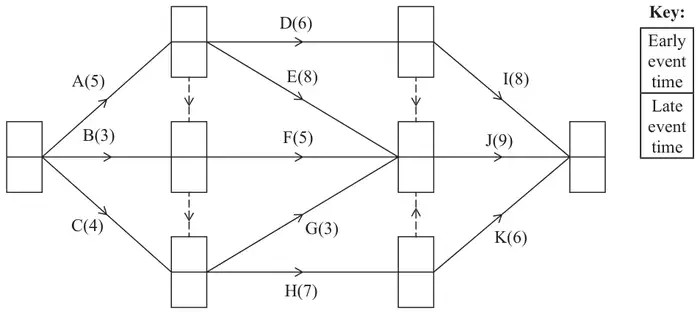
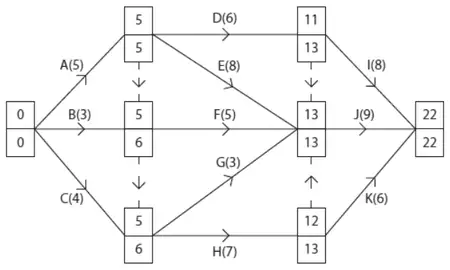
M1: All boxes completed, number generally increasing L to R (condone one “rogue”) and decreasing R to L (condone one “rogue”)
A1: CAO (all top boxes correct)
A1: CAO (all bottom boxes correct)
| Scheme | Marks | AO |
|---|---|---|
| (i) Minimum project completion time is 22 hours | B1ft | 1.1b |
| (ii) Critical activities are A, E and J | B1 | 1.1b |
| (2) |
Notes
(c)(i) B1ft: CAO following through their completed top boxes from (b)
(c)(ii) B1: CAO (A, E and J only)
| Scheme | Marks | AO |
|---|---|---|
| H could be delayed by 13 – 5 – 7 = 1 hour | B1ft | 3.4 |
| (1) |
Notes
B1ft: Correct calculation for their activity H (from (b)) – must see all 3 numbers (so just 13 – 12 = 1 is B0)
| Scheme | Marks | AO |
|---|---|---|
| \(\dfrac{5 + 3 + 4 + \ldots + 8 + 9 + 6}{22}\) | M1 | 1.1b |
| = 2.909... so a lower bound of 3 workers | A1 | 2.2a |
| (2) |
Notes
M1: (55 to 73 inclusive) / their duration (their answers to (b) and (c)(i) must be consistent)
A1: Correct deduction of lower bound from a correct calculation – answer of 3 with no working scores no marks in this part
| Scheme | Marks | AO |
|---|---|---|
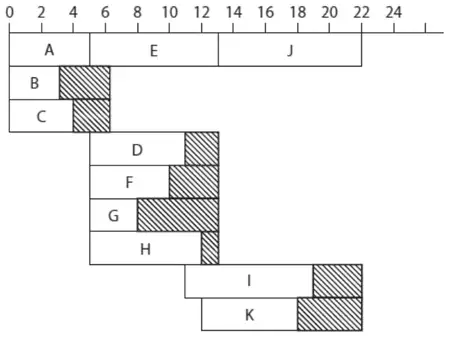 | M1 A1 A1 | 2.1 1.1b 1.1b |
| (3) |
Notes
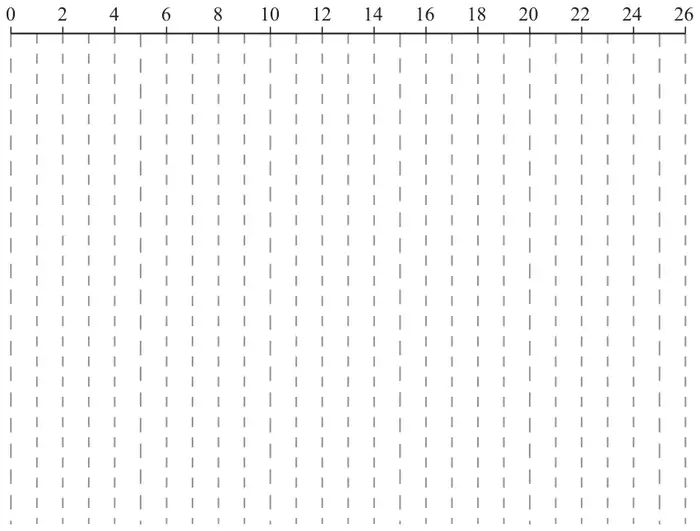
M1: At least 9 activities including at least 6 floats
A1: All correct critical activities present and 5 non-critical activities correct
A1: All non-critical activities correct
| Scheme | Marks | AO |
|---|---|---|
| e.g. between times 5 and 13 activities E, D, F, G and H must all be happening. The total time to complete these five activities is 29 hours and 29/8 > 3 so it is not possible to complete with the lower bound of 3 workers e.g. at time 8.5 activities E, D, F and H must be happening so not possible to complete with only 3 workers | B1 | 3.4 |
| (1) | ||
| (14 marks) |
Notes
B1: Correct reasoning that it is not possible to complete the project with only 3 workers – candidates must refer to both times and activities for this mark (as an indication that they have used (f))