
June 2019 Paper 2 Q9
9. A research engineer is testing the effectiveness of the braking system of a car when it is driven in wet conditions.
The engineer measures and records the braking distance, \(d\) metres, when the brakes are applied from a speed of \(V\)\(\,\text{km}\,\text{h}^{-1}\).
Graphs of \(d\) against \(V\) and \(\log_{10} d\) against \(\log_{10} V\) were plotted.
The results are shown below together with a data point from each graph.
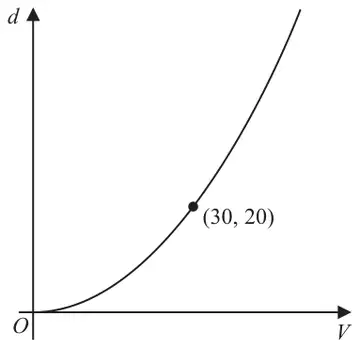
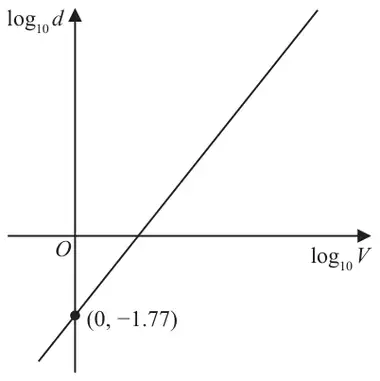
Using the information given in Figure 5, with \(k = 0.017\)
Sean is driving this car at 60\(\,\text{km}\,\text{h}^{-1}\) in wet conditions when he notices a large puddle in the road 100 m ahead. It takes him 0.8 seconds to react before applying the brakes.
| Scheme | Marks | AO |
|---|---|---|
| Way 1 \(\{d = kV^n \Rightarrow\}\ \log_{10} d = \log_{10} k + n\log_{10} V\) or \(\log_{10} d = m\log_{10} V + c\) or \(\log_{10} d = m\log_{10} V - 1.77\) seen or used as part of their argument | M1 | 2.1 |
| Alludes to \(d = kV^n\) and gives a full explanation by comparing their result with a linear model e.g. \(Y = MX + C\) | A1 | 2.4 |
| \(\{k =\}\ 10^{-1.77} = 0.017\) or \(\log 0.017 = -1.77\) linked together in the same part of the question | B1 * | 1.1b |
| (3) |
Notes
(a) Way 2
| Scheme | Marks | AO |
|---|---|---|
| \(\log_{10} d = m\log_{10} V + c\) or \(\log_{10} d = m\log_{10} V - 1.77\) or \(\log_{10} d = \log_{10} k + n\log_{10} V\) seen or used as part of their argument | M1 | 2.1 |
| \(\{d = kV^n \Rightarrow\}\ \log_{10} d = \log_{10}(kV^n)\) \(\Rightarrow \log_{10} d = \log_{10} k + \log_{10} V^n \Rightarrow \log_{10} d = \log_{10} k + n\log_{10} V\) | A1 | 2.4 |
| \(\{k =\}\ 10^{-1.77} = 0.017\) or \(\log 0.017 = -1.77\) linked together in the same part of the question | B1 * | 1.1b |
| (3) |
(a) Way 3
| Scheme | Marks | AO |
|---|---|---|
| Starts from \(\log_{10} d = m\log_{10} V + c\) or \(\log_{10} d = m\log_{10} V - 1.77\) | M1 | 2.1 |
| \(\log_{10} d = m\log_{10} V + c \Rightarrow d = 10^{m\log_{10} V + c} \Rightarrow d = 10^c V^m \Rightarrow d = kV^n\) or \(\log_{10} d = m\log_{10} V - 1.77 \Rightarrow d = 10^{m\log_{10} V - 1.77}\) \(\Rightarrow d = 10^{-1.77} V^m \Rightarrow d = kV^n\) | A1 | 2.4 |
| \(\{k =\}\ 10^{-1.77} = 0.017\) or \(\log 0.017 = -1.77\) linked together in the same part of the question | B1 * | 1.1b |
| (3) |
Note: In their solution to (a) and/or (b) condone writing \(\log\) in place of \(\log_{10}\)
Way 1
M1: See scheme
A1: See scheme
B1*: See scheme
Way 2
M1: See scheme
A1: Starts from \(d = kV^n\) (which they do not have to state) and progresses to \(\log_{10} d = \log_{10} k + n\log_{10} V\) with an intermediate step in their working.
B1*: See scheme
Way 3
M1: Starts their argument from \(\log_{10} d = m\log_{10} V + c\) or \(\log_{10} d = m\log_{10} V - 1.77\)
A1: Mathematical explanation is seen by showing any of either
- \(\log_{10} d = m\log_{10} V + c \to d = 10^c V^m\) or \(d = kV^n\)
- \(\log_{10} d = m\log_{10} V - 1.77 \to d = 10^{-1.77} V^m\) or \(d = kV^n\)
B1*: See scheme
All ways
Note: Allow B1 for \(\log_{10} 0.017 = -1.77\) or \(\log 0.017 = -1.77\)
Note: Give B0 in (a) for \(10^{-1.77} = 0.01698\ldots\) without reference to 0.017 in the same part
| Scheme | Marks | AO |
|---|---|---|
| \(\{d = 20,\ V = 30 \Rightarrow\}\ \ 20 = k(30)^n\) or \(\log_{10} 20 = \log_{10} k + n\log_{10} 30\) | M1 | 3.4 |
| \(20 = k(30)^n \Rightarrow \log 20 = \log k + n\log 30 \Rightarrow n = \dfrac{\log 20 - \log k}{\log 30} \Rightarrow n = \ldots\) or \(\log_{10} 20 = \log_{10} k + n\log_{10} 30 \Rightarrow n = \dfrac{\log_{10} 20 - \log_{10} k}{\log_{10} 30} \Rightarrow n = \ldots\) | M1 | 1.1b |
| \(\{n = \text{awrt } 2.08 \Rightarrow\}\ d = (0.017)V^{2.08}\) or \(\log_{10} d = -1.77 + 2.08\log_{10} V\) | A1 | 1.1b |
| Note: You can recover the A1 mark for a correct model equation given in part (c) | ||
| (3) |
Notes
M1: Applies \(V = 30\) and \(d = 20\) to their model (correct way round)
M1: Applies \((V, d) = (30, 20)\) or \((20, 30)\) and applies logarithms correctly leading to \(n = \ldots\)
A1: \(d = (0.017)V^{2.08}\) or \(\log_{10} d = -1.77 + 2.08\log_{10} V\) or \(\log_{10} d = \log_{10}(0.017) + 2.08\log_{10} V\)
Note: Allow \(k = \text{awrt } 0.017\) and/or \(n = \text{awrt } 2.08\) in their final model equation
Note: M0 M1 A0 is a possible score for (b)
| Scheme | Marks | AO |
|---|---|---|
| \(d = (0.017)(60)^{2.08}\) | M1 | 3.4 |
| M1 A1ft | 3.1b 3.2a |
| (3) | ||
| (9 marks) |
Notes
ADVICE: Ignore labelling (a), (b), (c) when marking this question
M1: Applies \(V = 60\) to their exponential model or their logarithmic model
M1: Uses their model in a correct problem-solving process of either
- adding a “thinking distance” to their value of their \(d\) to find an overall stopping distance
- applying 100 – “thinking distance” and finds their value of \(d\)
Note: \(\dfrac{1}{75}\) or 48 are examples of acceptable thinking distances
A1ft: Either adds 13.3… to their \(d\) to find a total stopping distance and gives a correct ft conclusion
or finds their \(d\) and a comparative 86.666…(m) or awrt 87 (m) and gives a correct ft conclusion
Note: The thinking distance must be dimensionally correct for the M1 mark. i.e. \(0.8 \times\) their velocity
Note: A thinking distance of awrt 13 and a value of \(d\) in the range \([81.5,\ 88.5]\) are required for A1ft
Note: Allow “Sean stops in time” or “Yes he stops in time” or “he misses the puddle” as relevant conclusions.
Note: A mark of M0 M1 A0 is possible in (c)