
October 2021 Paper 1 Q12
12.
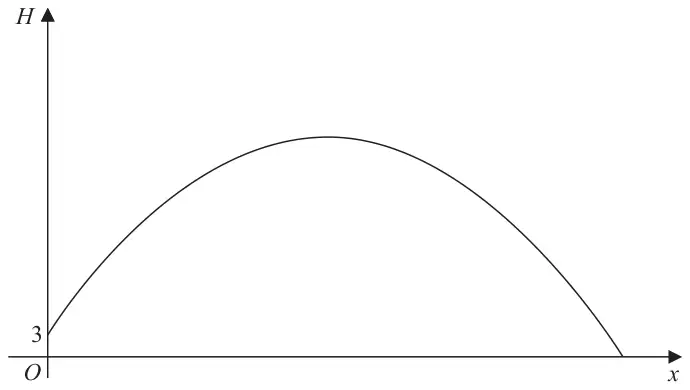
Figure 3 is a graph of the trajectory of a golf ball after the ball has been hit until it first hits the ground.
The vertical height, \(H\) metres, of the ball above the ground has been plotted against the horizontal distance travelled, \(x\) metres, measured from where the ball was hit.
The ball is modelled as a particle travelling in a vertical plane above horizontal ground.
Given that the ball
- is hit from a point on the top of a platform of vertical height 3 m above the ground
- reaches its maximum vertical height after travelling a horizontal distance of 90 m
- is at a vertical height of 27 m above the ground after travelling a horizontal distance of 120 m
Given also that \(H\) is modelled as a quadratic function in \(x\)
| Scheme | Marks | AO |
|---|---|---|
| \(H = ax^2 + bx + c\) and \(x = 0,\ H = 3 \Rightarrow H = ax^2 + bx + 3\) | M1 | 3.3 |
| \(H = ax^2 + bx + 3\) and \(x = 120,\ H = 27 \Rightarrow 27 = 14400a + 120b + 3\) or \(\dfrac{\mathrm{d}H}{\mathrm{d}x} = 2ax + b = 0\) when \(x = 90 \Rightarrow 180a + b = 0\) | M1 A1 | 3.1b 1.1b |
| \(H = ax^2 + bx + 3\) and \(x = 120,\ H = 27 \Rightarrow 27 = 14400a + 120b + 3\) and \(\dfrac{\mathrm{d}H}{\mathrm{d}x} = 2ax + b = 0\) when \(x = 90 \Rightarrow 180a + b = 0\) \(\Rightarrow a = \ldots,\ b = \ldots\) | dM1 | 3.1b |
| \(H = -\dfrac{1}{300}x^2 + \dfrac{3}{5}x + 3\) o.e. | A1 | 1.1b |
| (5) |
Notes
M1: Translates the problem into a suitable model and uses \(H = 3\) when \(x = 0\) to establish \(c = 3\)
Condone with \(a = \pm 1\) so \(H = x^2 + bx + 3\) will score M1 but little else
M1: For a correct attempt at using one of the two other pieces of information within a quadratic model
Either uses \(H = 27\) when \(x = 120\) (with \(c = 3\)) to produce a linear equation connecting \(a\) and \(b\) for the model Or differentiates and uses \(\dfrac{\mathrm{d}H}{\mathrm{d}x} = 0\) when \(x = 90\). Alternatives exist here, using the symmetrical nature of the curve, so they could use \(x = -\dfrac{b}{2a}\) at vertex or use point \((60,\ 27)\) or \((180,\ 3)\).
A1: At least one correct equation connecting \(a\) and \(b\). Remember "\(a\)" could have been set as negative so an equation such as \(27 = -14400a + 120b + 3\) would be correct in these circumstances.
dM1: Fully correct strategy that uses \(H = ax^2 + bx + 3\) with the two other pieces of information in order to establish the values of both \(a\) and \(b\) for the model
A1: Correct equation, not just the correct values of \(a\), \(b\) and \(c\). Award if seen in part (b)
The method using an alternative form of the equation can be scored in a very similar way.
The first M is for the completed square form of the quadratic showing a maximum at \(x = 90\)
So award M1 for \(H = \pm a(x - 90)^2 + c\) or \(H = \pm a(90 - x)^2 + c\). Condone for this mark an equation with \(a = 1 \Rightarrow H = (x - 90)^2 + c\) or \(c = 3 \Rightarrow H = a(x - 90)^2 + 3\) but will score little else
Alt (a)
| Scheme | Marks | AO |
|---|---|---|
| \(H = a(x + b)^2 + c\) and \(x = 90\) at \(H_{\max} \Rightarrow H = a(x - 90)^2 + c\) | M1 | 3.3 |
| \(H = 3\) when \(x = 0 \Rightarrow 3 = 8100a + c\) or \(H = 27\) when \(x = 120 \Rightarrow 27 = 900a + c\) | M1 A1 | 3.1b 1.1b |
| \(H = 3\) when \(x = 0 \Rightarrow 3 = 8100a + c\) and \(H = 27\) when \(x = 120 \Rightarrow 27 = 900a + c\) \(\Rightarrow a = \ldots,\ c = \ldots\) | dM1 | 3.1b |
| \(H = -\dfrac{1}{300}(x - 90)^2 + 30\) o.e | A1 | 1.1b |
| (5) |
Note that \(H = -\dfrac{1}{300}(x - 90)^2 + 30\) is equivalent to \(H = -\dfrac{1}{300}(90 - x)^2 + 30\)
Other versions using symmetry are also correct so please look carefully at all responses
E.g. Using a starting equation of \(H = a(x - 60)(x - 120) + b\) leads to \(H = -\dfrac{1}{300}(x - 60)(x - 120) + 27\)
| Scheme | Marks | AO |
|---|---|---|
| (i) \(x = 90 \Rightarrow H\left(= -\dfrac{1}{300}(90)^2 + \dfrac{3}{5}(90) + 3\right) = 30\text{ m}\) | B1 | 3.4 |
| (ii) \(H = 0 \Rightarrow -\dfrac{1}{300}x^2 + \dfrac{3}{5}x + 3 = 0 \Rightarrow x = \ldots\) | M1 | 3.4 |
| \(x = (-4.868\ldots,)\ 184.868\ldots\) \(\Rightarrow x = 185\ (\text{m})\) | A1 | 3.2a |
| (3) |
Notes
(b)(i) B1: Correct height including the units. CAO
(b)(ii) M1: Uses \(H = 0\) and attempts to solve for \(x\). Usual rules for quadratics.
A1: Discards the negative solution (may not be seen) and identifies awrt 185 m. Condone lack of units
Alt (b)
| Scheme | Marks | AO |
|---|---|---|
| (i) \(x = 90 \Rightarrow H = 0^2 + 30 = 30\text{ m}\) | B1 | 3.4 |
| (1) | ||
| (ii) \(H = 0 \Rightarrow 0 = -\dfrac{1}{300}(x - 90)^2 + 30 \Rightarrow x = \ldots\) | M1 | 3.4 |
| \(\Rightarrow x = 185\ (\text{m})\) | A1 | 3.2a |
| (2) |
| Scheme | Marks | AO |
|---|---|---|
Examples must focus on why the model may not be appropriate or give values/situations where the model would break down: E.g.
| B1 | 3.5b |
| (1) | ||
| (9 marks) |
Notes
B1: Candidate should either refer to an issue with one of the four aspects of how the situation has been modelled or give a situation where the model breaks down
- the ball has been modelled as a particle
- there may be trees (or other hazards) in the way that would affect the motion
Condone answers (where the link to the model is not completely made) such as
- the ball will spin
- ground is not flat
Do not accept answers which refer to the situation after it hits the ground (this isn’t what was modelled)
- the ball will bounce after hitting the ground
- it gives a negative height for some values for \(x\)
Do not accept answers that do not refer to the model in question, or else give single word vague answers
- the height of tee may have been measured incorrectly
- "friction", "spin", "force" etc
- it does not take into account the weight of the ball
- it depends on how good the golfer is
- the shape of the ball will affect the motion
- you cannot hit a ball the same distance each time you hit it