
October 2020 Paper 3 Q5
5
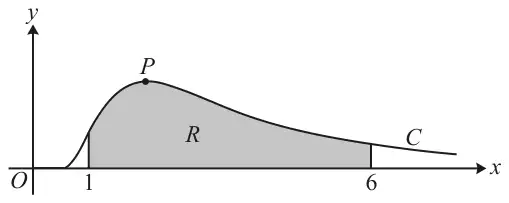
The diagram shows the curve \(C\) with parametric equations
\(x = \dfrac{3}{t}\), \(y = t^3\mathrm{e}^{-2t}\), where \(t \gt 0\).
The maximum point on \(C\) is denoted by \(P\).
The shaded region \(R\) is enclosed by the curve, the \(x\)-axis and the lines \(x = 1\) and \(x = 6\).
\(\displaystyle\int_a^b 3t\mathrm{e}^{-2t}\,\mathrm{d}t\),
where \(a\) and \(b\) are constants to be determined. [3]
| Scheme | Marks | AO |
|---|---|---|
| \(\dfrac{\mathrm{d}y}{\mathrm{d}t} = 3t^2\mathrm{e}^{-2t} + t^3\left(-2\mathrm{e}^{-2t}\right)\) | M1* | 2.1 |
| \(\dfrac{\mathrm{d}y}{\mathrm{d}t} = 0 \Rightarrow t^2\mathrm{e}^{-2t}(3 - 2t) = 0 \Rightarrow t = \ldots\) | M1dep* | 1.1 |
| \(t = \tfrac{3}{2}\) | A1 | 1.1 |
| \(P\left(2, \tfrac{27}{8}\mathrm{e}^{-3}\right)\) | A1 | 2.2a |
| [4] |
Notes
M1*: Attempts to differentiate \(y\) with respect to \(t\) using the product rule – answer of the form \(\dfrac{\mathrm{d}y}{\mathrm{d}t} = \lambda t^2\mathrm{e}^{-2t} + \mu t^3\mathrm{e}^{-2t}\) where \(\lambda, \mu \ne 0\)
or \(y' = \alpha x^{-5}\mathrm{e}^{-6x^{-1}}(\beta x + \gamma)\) where \(\alpha, \beta, \gamma \ne 0\)
M1dep*: Sets their derivative equal to zero and solves for \(t\)
Or their \(\dfrac{\mathrm{d}y}{\mathrm{d}x}\) set = 0 and solve for \(x\)
A1: From correct working only (or for \(x = 2\))
A1: From correct working only
\(y\)-coordinate must be exact but ISW
| Scheme | Marks | AO |
|---|---|---|
| \(\dfrac{\mathrm{d}x}{\mathrm{d}t} = -3t^{-2}\) and \(\displaystyle\int y\frac{\mathrm{d}x}{\mathrm{d}t}\,\mathrm{d}t\) | M1 | 2.1 |
| \(x = 6 \Rightarrow t = 0.5\) and \(x = 1 \Rightarrow t = 3\) | B1 | 1.1 |
| Area \(\displaystyle = \int_3^{0.5} t^3\mathrm{e}^{-2t}\left(-\frac{3}{t^2}\right)\mathrm{d}t = \int_3^{0.5} -3t\mathrm{e}^{-2t}\,\mathrm{d}t = \int_{0.5}^{3} 3t\mathrm{e}^{-2t}\,\mathrm{d}t\) | A1 | 2.2a |
| [3] |
Notes
M1: Differentiates \(x\) with respect to \(t\) and attempts to set up integral for the required area
With \(\dfrac{\mathrm{d}x}{\mathrm{d}t} = kt^{-2}\) with non-zero \(k\)
B1: Stating 0.5 and 3 is sufficient for this mark
If not attempted in (b) then this B mark can be awarded if seen in (c)
A1: Must be correctly shown
| Scheme | Marks | AO |
|---|---|---|
| \(u = 3t\), and \(\mathrm{d}v\) or \(\dfrac{\mathrm{d}v}{\mathrm{d}t} = \mathrm{e}^{-2t}\) | M1* | 1.1 |
| \(\displaystyle\int 3t\mathrm{e}^{-2t}\,\mathrm{d}t = -\tfrac{3}{2}t\mathrm{e}^{-2t} + \tfrac{3}{2}\int \mathrm{e}^{-2t}\,\mathrm{d}t\) | A1 | 1.1 |
| \(= \ldots - \tfrac{3}{4}\mathrm{e}^{-2t}\ (+c)\) | A1 | 1.1 |
| \(\left[-\tfrac{3}{2}t\mathrm{e}^{-2t} - \tfrac{3}{4}\mathrm{e}^{-2t}\right]_{0.5}^{3} = \left(-\tfrac{3}{2}(3)\mathrm{e}^{-6} - \tfrac{3}{4}\mathrm{e}^{-6}\right)\) \(\qquad - \left(-\tfrac{3}{2}(0.5)\mathrm{e}^{-1} - \tfrac{3}{4}\mathrm{e}^{-1}\right)\) | M1dep* | 1.1 |
| Area \(= -\tfrac{21}{4}\mathrm{e}^{-6} + \tfrac{3}{2}\mathrm{e}^{-1}\) | A1 | 2.2a |
| [5] |
Notes
M1*: Integrating by parts as far as \(\mathrm{f}(t) \pm \displaystyle\int \mathrm{g}(t)\,\mathrm{d}t\)
Ignore limits for first three marks and allow those who consider \(-\displaystyle\int 3t\mathrm{e}^{-2t}\,\mathrm{d}t\) for possibly full marks
A1, A1: Allow correct un-simplified for both A marks
M1dep*: Use of their \(t\)-limits (so not 1 and 6) in fully integrated expression (must subtract bottom limit from top limit)
A1: ISW once correct exact answer seen