
June 2019 Paper 2 Q14
14 The pre-release material includes data concerning crude death rates in different countries of the world. Fig. 14.1 shows some information concerning crude death rates in countries in Europe and in Africa.
| Europe | Africa | |
|---|---|---|
| \(n\) | 48 | 56 |
| minimum | 6.28 | 3.58 |
| lower quartile | 8.50 | 7.31 |
| median | 9.53 | 8.71 |
| upper quartile | 11.41 | 11.93 |
| maximum | 14.46 | 14.89 |
The crude death rate in Libya is recorded as 3.58 and the population of Libya is recorded as 6 411 776.
The median age in Germany is 46.5 and the crude death rate is 11.42. The median age in Cyprus is 36.1 and the crude death rate is 6.62.
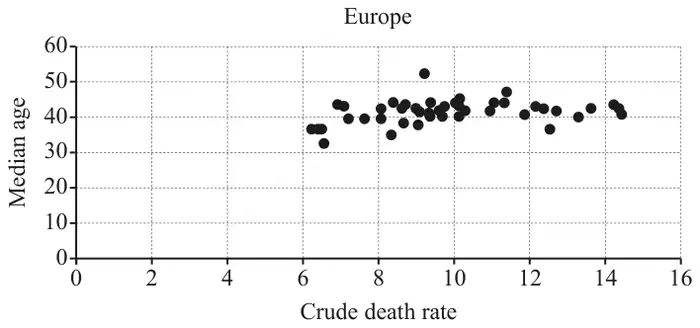
Fig. 14.2 shows a scatter diagram of median age against crude death rate for countries in Africa and Fig. 14.3 shows a scatter diagram of median age against crude death rate for countries in Europe.
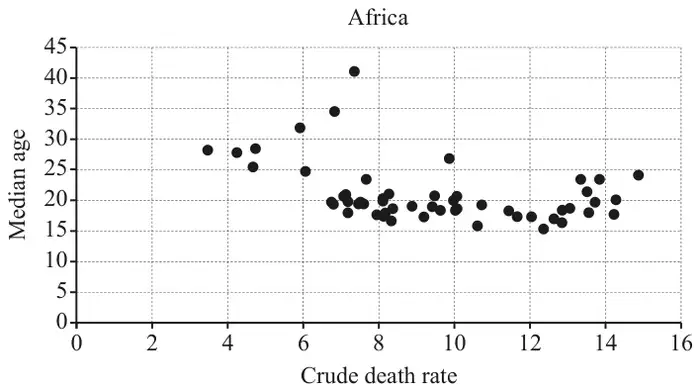
The rank correlation coefficient for the data shown in Fig. 14.2 is \(-0.281\,206\).
The rank correlation coefficient for the data shown in Fig. 14.3 is \(0.335\,215\).
| Scheme | Marks | AO |
|---|---|---|
| the data was not available for all countries oe | B1 | 2.4 |
| [1] |
| Scheme | Marks | AO |
|---|---|---|
| use of \(Q_1 - 1.5 \times (Q_3 - Q_1)\) and \(Q_3 + 1.5 \times (Q_3 - Q_1)\) seen for either set | M1 | 3.1b |
| \(4.135 < 6.28\) and \(15.775 > 14.46\) | A1 | 1.1 |
| \(0.38 < 3.58\) and \(18.86 > 14.89\) | A1 | 1.1 |
| [3] |
Notes
if A0A0 allow SC1 for 4.135, 15.775, 0.38 and 18.86 all seen
| Scheme | Marks | AO |
|---|---|---|
| 22 954 isw | B1 | 3.1b |
| [1] |
Notes
B1: allow 22 955, 22 950 or 23 000
NB \(6411776 \times \frac{3.58}{1000}\)
| Scheme | Marks | AO |
|---|---|---|
| there are almost certainly more “old” people in the population oe | B1 | 2.4 |
| [1] |
| Scheme | Marks | AO |
|---|---|---|
| in African countries there is a negative association / relationship between (or negative correlation between the ranks of) median age and crude death rate, but in Europe there seems to be a positive association / relationship between (or positive correlation between the ranks of) median age and crude death rate | B1 | 2.4 |
| the “association” / “relationship between” or “correlation between the ranks of” median age and crude death rate (appears to be) stronger in Europe | B1 | 2.4 |
| [2] |
Notes
B1: do not allow “negative correlation” and / or “positive correlation”
B1: allow B1 both relationships are weak oe
comment comparing and contrasting type of relationship in both continents for B1, and one comment comparing and contrasting strength of relationship in both continents for B1
allow equivalent explanations in words eg as median age increases crude death rates decrease in Africa and similar for Europe