
June 2023 Paper 2 Q12
12.
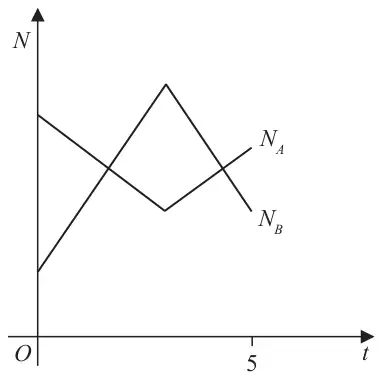
The number of subscribers to two different music streaming companies is being monitored.
The number of subscribers, \(N_{\mathrm{A}}\), in thousands, to company A is modelled by the equation\[N_{\mathrm{A}} = |t - 3| + 4 \qquad t \geqslant 0\]where \(t\) is the time in years since monitoring began.
The number of subscribers, \(N_{\mathrm{B}}\), in thousands, to company B is modelled by the equation\[N_{\mathrm{B}} = 8 - |2t - 6| \qquad t \geqslant 0\]where \(t\) is the time in years since monitoring began.
Figure 2 shows a sketch of the graph of \(N_{\mathrm{A}}\) and the graph of \(N_{\mathrm{B}}\) over a 5-year period.
Use the equations of the models to answer parts (a), (b), (c) and (d).
When \(t = T\) company A reduced its subscription prices and the number of subscribers increased.
| Scheme | Marks | AO |
|---|---|---|
| \(N_A - N_B = (3 + 4) - (8 - 6) = \ldots\) | M1 | 3.4 |
| 5000 (subscribers) | A1 | 3.2a |
| (2) |
Notes
M1: Uses the models to find the difference when \(t = 0\). Allow slips in evaluating \(N_{\mathrm{A}}\) and \(N_{\mathrm{B}}\) but it must be clear that \(t = 0\) is being used. Just 5 with no working implies M1.
A1: 5000 or 5 thousand (subscribers) (5 is A0)
| Scheme | Marks | AO |
|---|---|---|
| \((T =)\ 3\) | B1 | 3.4 |
| This was the point when company A had the lowest number of subscribers | B1 | 2.4 |
| (2) |
Notes
B1: \((t / T =)\ 3\) Just look for the number 3 so e.g. \(t \gt 3\) or e.g. “just after 3” is acceptable.
If more than one value is offered then score B0 unless it is clear that the 3 is intended.
Must be seen in (b) not just on their diagram.
B1: Any acceptable reason e.g.
- This was the point when company A had the lowest number of subscribers
- After this point the number of subscribers started to increase
- It is the minimum
- Condone “it is the turning point”
- The graph changes direction
- It is the vertex
- The gradient becomes positive
- \(N_{\mathrm{A}}\) increased
Allow this mark even if the first B mark was not scored e.g. \(T = 3.5\) because the graph starts to increase scores B0B1
Do not allow contradictory statements.
Do not allow:
- The graph reflects at \(t = 3\) on its own without further clarification
| Scheme | Marks | AO |
|---|---|---|
| \(-t + 7 = 2t + 2\) o.e. or \(t + 1 = 14 - 2t\) o.e. | B1 | 3.1a |
| \(-t + 7 = 2t + 2\) o.e. \(\Rightarrow t = \ldots\) or \(t + 1 = 14 - 2t\) o.e. \(\Rightarrow t = \ldots\) | M1 | 3.4 |
| One of the two critical values \(t = \dfrac{5}{3}\) or \(t = \dfrac{13}{3}\) | A1 | 1.1b |
| Chooses the outside region for their two values of \(t\) Both of \(t \lt \text{``}\dfrac{5}{3}\text{''},\quad t \gt \text{``}\dfrac{13}{3}\text{''}\) | A1ft | 2.2a |
| \(\left\{t \in \mathbb{R} : t \lt \dfrac{5}{3}\right\} \cup \left\{t \in \mathbb{R} : t \gt \dfrac{13}{3}\right\}\) | A1 | 2.5 |
| (5) |
Notes
B1: Forms one valid equation (allow an equation or any inequality sign)
M1: Attempts to solve one valid equation (allow an equation or any inequality sign)
A1: For either \(t = \dfrac{5}{3}\) or \(t = \dfrac{13}{3}\) only (allow an equation or any inequality sign) or exact equivalent
Must be seen or used in part (c).
See notes below for attempts that use “squaring” to find the values of t.
A1ft: Chooses the outside region for their two values of t where \(t \gt 0\).
So for \(t = a\) and \(t = b\) where \(0 \lt a \lt b\) should be \(t \lt a,\ t \gt b\). Allow , /or/and/\(\cup\)/\(\cap\)
Condone if incorrectly combined e.g. \(\text{``}\dfrac{13}{3}\text{''} \lt t \lt \text{``}\dfrac{5}{3}\text{''}\) but not \(\text{``}\dfrac{5}{3}\text{''} \lt t \lt \text{``}\dfrac{13}{3}\text{''}\)
A1: Fully correct solution in the form \(\left\{t : t \lt \dfrac{5}{3}\right\} \cup \left\{t : t \gt \dfrac{13}{3}\right\}\) or \(\left\{t \,\middle|\, t \lt \dfrac{5}{3}\right\} \cup \left\{t \,\middle|\, t \gt \dfrac{13}{3}\right\}\) or \(\left(0,\ \dfrac{5}{3}\right) \cup \left(\dfrac{13}{3},\ 5\right)\) either way around but condone \(\left\{t \lt \dfrac{5}{3}\right\} \cup \left\{t \gt \dfrac{13}{3}\right\},\ \left\{t : t \lt \dfrac{5}{3} \cup t \gt \dfrac{13}{3}\right\},\ \left\{t \lt \dfrac{5}{3} \cup t \gt \dfrac{13}{3}\right\}\) or \(\left(-\infty,\ \dfrac{5}{3}\right) \cup \left(\dfrac{13}{3},\ \infty\right)\).
It is not necessary to mention \(\mathbb{R}\), e.g. \(\left\{t : t \in \mathbb{R},\ t \gt \dfrac{13}{3}\right\} \cup \left\{t : t \in \mathbb{R},\ t \lt \dfrac{5}{3}\right\}\)
Look for \(\{\ \}\) and \(\cup\) or condone \(\left(-\infty,\ \dfrac{5}{3}\right) \cup \left(\dfrac{13}{3},\ \infty\right)\)
Do not allow solutions not in set notation such as \(t \lt \dfrac{5}{3}\) or \(t \gt \dfrac{13}{3}\).
Note that a lower bound for \(t \lt \dfrac{5}{3}\) and an upper bound for \(t \gt \dfrac{13}{3}\) are not required but may be included e.g. \(\left\{t \in \mathbb{R} : 0 \lt t \lt \dfrac{5}{3}\right\} \cup \left\{t \in \mathbb{R} : \dfrac{13}{3} \lt t \lt 5\right\}\) or \(\left\{t \in \mathbb{R} : 0 \leqslant t \lt \dfrac{5}{3}\right\} \cup \left\{t \in \mathbb{R} : \dfrac{13}{3} \lt t \leqslant 5\right\}\)
Note that the marks in this part require valid equations to be solved. They must have removed the mod brackets and arrived at an equation equivalent to \(-t + 7 = 2t + 2\) or \(t + 1 = 14 - 2t\) (all you need to check initially is whether their equation without mod brackets is equivalent to one of these).
Note that \(\left\{t : t \lt \dfrac{5}{3},\ t \gt \dfrac{13}{3}\right\}\) is condoned for the A1ft but not for the final A1.
If x is used in their set notation then final A0, but we would condone this for the penultimate A1ft.
See notes below for answers given with no working.
Guidance for attempts that use “squaring” to find the values of t in (c):
Way 1:
| Scheme | Marks | AO |
|---|---|---|
| \((-t + 7)^2 = (2t + 2)^2\) o.e. or \((t + 1)^2 = (14 - 2t)^2\) o.e. | B1 | 3.1a |
| \((-t + 7)^2 = (2t + 2)^2 \Rightarrow t = \ldots\) o.e. (Gives \(-9\) and \(\dfrac{5}{3}\)) or \((t + 1)^2 = (14 - 2t)^2 \Rightarrow t = \ldots\) o.e. (Gives 15 and \(\dfrac{13}{3}\)) | M1 | 3.4 |
| One of the two critical values \(t = \dfrac{5}{3}\) or \(t = \dfrac{13}{3}\) | A1 | 1.1b |
| Chooses the outside region for their two values of \(t\) Both of \(t \lt \text{``}\dfrac{5}{3}\text{''},\quad t \gt \text{``}\dfrac{13}{3}\text{''}\) | A1ft | 2.2a |
| \(\left\{t \in \mathbb{R} : t \lt \dfrac{5}{3}\right\} \cup \left\{t \in \mathbb{R} : t \gt \dfrac{13}{3}\right\}\) | A1 | 2.5 |
Way 2:
| Scheme | Marks | AO |
|---|---|---|
| \(|t - 3| + 4 = 8 - |2t - 6| \Rightarrow |t - 3| + |2t - 6| = 4 \Rightarrow 3t - 9 = 4\) o.e. | B1 | 3.1a |
| \((3t - 9)^2 = 4^2 \Rightarrow 9t^2 - 54t + 81 = 16 \Rightarrow 9t^2 - 54t + 65 = 0 \Rightarrow t = \ldots\) (Gives \(\dfrac{5}{3}\) and \(\dfrac{13}{3}\)) | M1 | 3.4 |
| One of the two critical values \(t = \dfrac{5}{3}\) or \(t = \dfrac{13}{3}\) | A1 | 1.1b |
| Chooses the outside region for their two values of \(t\) Both of \(t \lt \text{``}\dfrac{5}{3}\text{''},\quad t \gt \text{``}\dfrac{13}{3}\text{''}\) | A1ft | 2.2a |
| \(\left\{t \in \mathbb{R} : t \lt \dfrac{5}{3}\right\} \cup \left\{t \in \mathbb{R} : t \gt \dfrac{13}{3}\right\}\) | A1 | 2.5 |
B1: Forms one valid equation and squares both sides (allow an equation or any inequality sign)
May be implied by e.g. \((t - 3 + 4)^2 = (8 - (2t - 6))^2\)
Alternatively, arrives at \(3t - 9 = 4\) (o.e.) as in way 2.
M1: Attempts to solve one valid equation after squaring both sides (allow an equation or any inequality sign). Note that it is acceptable to just solve \(3t - 9 = 4\)
A1: As in main scheme. A1ft: As in main scheme. A1: As in main scheme.
Note: the following is common and scores 00000.\[|t - 3| + 4 = 8 - |2t - 6| \Rightarrow (t - 3)^2 + 4 = 8 - (2t - 6)^2\]Which typically leads to\[t = \frac{15 \pm 4\sqrt{15}}{5}\]
Guidance for answers only in part (c):
\(t \ldots\) awrt 1.7 or \(t \ldots\) awrt 4.3 where … is any inequality or equation scores 11000
\(t \ldots \dfrac{5}{3}\) or \(t \ldots \dfrac{13}{3}\) where … is any inequality or equation scores 11100 for one correct c.v.
Both \(t \lt\) awrt 1.7 and \(t \gt b\) where \(\left\{b \gt \dfrac{5}{3}\right\}\) scores 11010 for outside region.
Both \(t \lt a\) and \(t \gt\) awrt 4.3 where \(\left\{a \lt \dfrac{13}{3}\right\}\) scores 11010 for outside region.
Both \(t \lt \dfrac{5}{3}\) and \(t \gt b\) where \(\left\{b \gt \dfrac{5}{3}\right\}\) scores 11110 for outside region with one correct.
Both \(t \lt a\) and \(t \gt \dfrac{13}{3}\) where \(\left\{a \lt \dfrac{13}{3}\right\}\) scores 11110 for outside region with one correct.
Both \(t \lt \dfrac{5}{3}\) and \(t \gt \dfrac{13}{3}\) scores 11110 for outside region with one correct.
Fully correct e.g. \(\left\{t : t \lt \dfrac{5}{3}\right\} \cup \left\{t : t \gt \dfrac{13}{3}\right\}\) scores 11111
| Scheme | Marks | AO |
|---|---|---|
| The number of subscribers will become negative (when \(t \gt 7\)) | B1 | 3.5b |
| (1) | ||
| (10 marks) |
Notes
B1: Requires any indication that the number of subscribers will become negative. E.g.
- It allows negative subscribers (which isn’t possible)
- \(8 - |2t - 6| \geqslant 0 \Rightarrow t \leqslant 7\) so not valid after \(t = 7\) but condone not valid for t after (any value above 7)
But not
- Subscribers will become zero