
June 2021 Paper 1 Q9
9 The table below shows the annual global production of plastics, \(P\), measured in millions of tonnes per year, for six selected years.
| Year | 1980 | 1985 | 1990 | 1995 | 2000 | 2005 |
|---|---|---|---|---|---|---|
| \(P\) | 75 | 94 | 120 | 156 | 206 | 260 |
It is thought that \(P\) can be modelled by
\[P = A \times 10^{kt}\]where \(t\) is the number of years after 1980 and \(A\) and \(k\) are constants.
(a) Show algebraically that the graph of \(\log_{10} P\) against \(t\) should be linear. [3 marks]
(b)
(i) Complete the table below.
| \(t\) | 0 | 5 | 10 | 15 | 20 | 25 |
|---|---|---|---|---|---|---|
| \(\log_{10} P\) | 1.88 | 1.97 | 2.08 | 2.31 |
[1 mark]
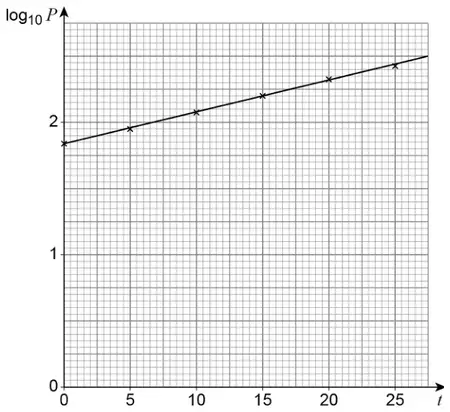
(ii) Plot \(\log_{10} P\) against \(t\), and draw a line of best fit for the data. [2 marks]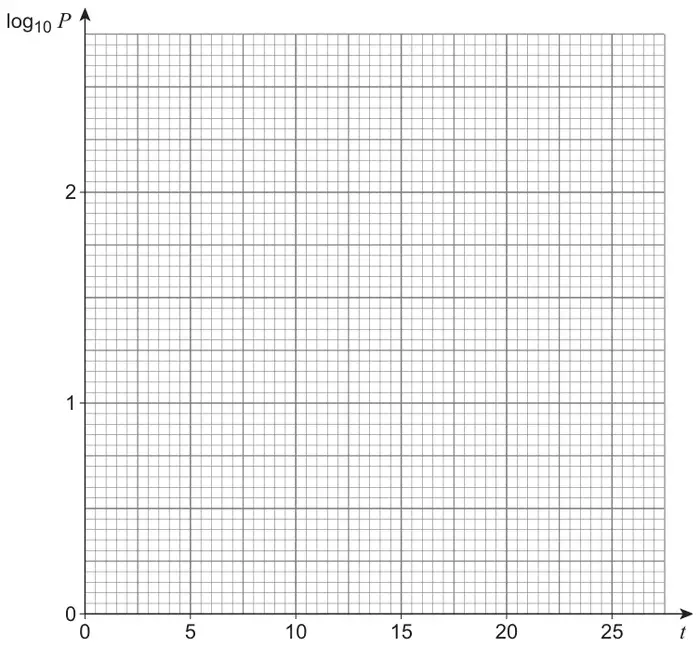
(c)
(i) Hence, show that \(k\) is approximately 0.02 [2 marks]
(ii) Find the value of \(A\). [1 mark]
(d) Using the model with \(k = 0.02\) predict the number of tonnes of annual global production of plastics in 2030. [2 marks]
(e) Using the model with \(k = 0.02\) predict the year in which \(P\) first exceeds 8000 [3 marks]
(f) Give a reason why it may be inappropriate to use the model to make predictions about future annual global production of plastics. [1 mark]
| Scheme | Marks | AO |
|---|---|---|
| Takes \(\log_{10}\) of both sides to obtain \(\log_{10} P = \log_{10}\left(A \times 10^{kt}\right)\) Or States that \(A = 10^c\) | M1 | 1.1a |
| Obtains \(\log_{10} P = \log_{10} A + \log_{10} 10^{kt}\) Or \(P = 10^{kt + c}\) | A1 | 1.1b |
| Completes rigorous argument to show \(\log_{10} P = \log_{10} A + kt\) Or \(\log_{10} P = kt + c\) | R1 | 2.1 |
| (3) |
Typical solution
\[\log_{10} P = \log_{10}\left(A \times 10^{kt}\right)\]\[\log_{10} P = \log_{10} A + \log_{10} 10^{kt}\]\[\log_{10} P = \log_{10} A + kt\]| Scheme | Marks | AO |
|---|---|---|
| (i) Completes table. | B1 | 1.1b |
| (1) | ||
| (ii) Plots at least four points correctly. Allow +/− one small square | M1 | 1.1a |
| Draws a ruled line of best fit from t=0 to t=25 or better CSO | A1 | 1.1b |
| (2) |
Typical solution
(i)
| \(t\) | 0 | 5 | 10 | 15 | 20 | 25 |
|---|---|---|---|---|---|---|
| \(\log_{10} P\) | 1.88 | 1.97 | 2.08 | 2.19 | 2.31 | 2.41 |
(ii)
| Scheme | Marks | AO |
|---|---|---|
| (i) Calculates the gradient of the graph either using the line of best fit or two points from the table of values | M1 | 1.1a |
| Obtains a value of k which rounds to 0.02 | R1 | 1.1b |
| (2) | ||
| (ii) Infers the value of \(A\) Uses 75 from data or uses \(10^{\text{their intercept}}\) | B1F | 2.2b |
| (1) |
Typical solution
(i)
\[k = \frac{2.41 - 1.88}{25}\]\[= 0.0212\]\[\approx 0.02\](ii)
\(A = 75\)
| Scheme | Marks | AO |
|---|---|---|
| Substitutes \(t = 50\) into their model of the form \(P = A \times 10^{0.02t}\) PI by 750 | M1 | 3.4 |
| Obtains the value for the number of tonnes of annual global production of plastics. Follow through their \(70 \lt A \lt 90\) | A1F | 3.2a |
| (2) |
Typical solution
\[P = 75 \times 10^{0.02 \times 50}\]750 million tonnes
| Scheme | Marks | AO |
|---|---|---|
| Forms an equation or inequality using their model of the form \(P = A \times 10^{0.02t}\) and \(P = 8000\) | M1 | 3.4 |
| Obtains t=101.4 AWFW [97.44, 102.90] | A1F | 1.1b |
| Interprets their answer as a year by calculating their (integer part of t)+1980+1, provided their t>50 | A1F | 3.2a |
| (3) |
Typical solution
\[8000 = 75 \times 10^{0.02 \times t}\]\[t = 101.401\]2082
| Scheme | Marks | AO |
|---|---|---|
| Gives a reason in context why the model for the production of plastics will be inappropriate. Eg It is not appropriate to extrapolate the future global production of plastics from the date provided. The global production of plastics may decrease in the future. | E1 | 3.5b |
| (1) | ||
| (15 marks) |
Typical solution
The world will produce less plastics to be more environmentally friendly.