
June 2022 Paper 3 Q9
9
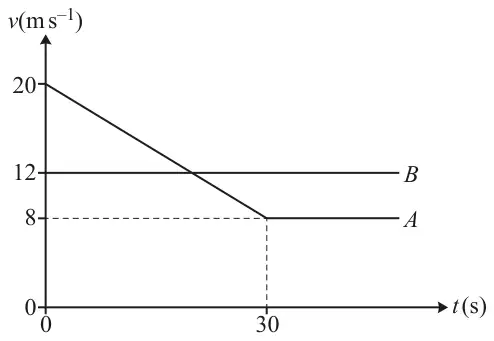
The diagram shows a velocity-time graph representing the motion of two cars \(A\) and \(B\) which are both travelling along a horizontal straight road. At time \(t = 0\), car \(B\), which is travelling with constant speed \(12\,\mathrm{m\,s^{-1}}\), is overtaken by car \(A\) which has initial speed \(20\,\mathrm{m\,s^{-1}}\).
From \(t = 0\) car \(A\) travels with constant deceleration for 30 seconds. When \(t = 30\) the speed of car \(A\) is \(8\,\mathrm{m\,s^{-1}}\) and the car maintains this speed in its subsequent motion.
| Scheme | Marks | AO |
|---|---|---|
| \(8 = 20 + 30a\) | M1 | 3.4 |
| \(a = -0.4\) so deceleration is 0.4 (\(\mathrm{m\,s^{-2}}\)) | A1 | 1.1 |
| [2] |
Notes
M1: Use of \(v = u + at\) with given values (allow \(v = 20\) and \(u = 8\))
A1: Allow 0.4 or \(-0.4\)
| Scheme | Marks | AO |
|---|---|---|
| Distance travelled by \(B\): \(12t\) | B1 | 1.1 |
| Distance travelled by \(A\): \(\dfrac{1}{2}(8 + 20)(30) + 8(t - 30)\) or \(\dfrac{1}{2}(30)(12) + 8t\) | B1 | 1.1 |
| \(12t =\) ‘420’ \(+ 8t -\) ‘240’ | M1 | 3.1b |
| \(t = 45\) | A1 | 1.1 |
| [4] |
Notes
B1: Or first 30 seconds: \(B\) travels \(12(30)\) \((= 360)\)
B1: Or first 30 seconds: \(A\) travels \(0.5(8 + 20)(30)\) \((= 420)\)
M1: M1 for a (possibly unsimplified) correct equation/inequality in \(t\) where ‘360’ and ‘420’ must have been correct unsimplified e.g. ‘420’ − ‘360’ \(= (t - 30)(12 - 8)\), \(12(t - 30) +\) ‘360’ \(= 8(t - 30) +\) ‘420’, ‘420’ \(+ 8(t - 30) = 12t\) etc.
Or for a correct equation in another time variable e.g. \(12T +\) ‘360’ \(= 8T +\) ‘420’ and \(T = t - 30\) seen or implied
If an inequality used, then allow incorrect direction or strict inequality symbol for this mark
A1: Allow \(t \gt 45 \Rightarrow t = 45\)