
October 2020 Paper 2 Q4
4 Fig. 4 shows a cumulative frequency diagram for the time spent revising mathematics by year 11 students at a certain school during a week in the summer term.
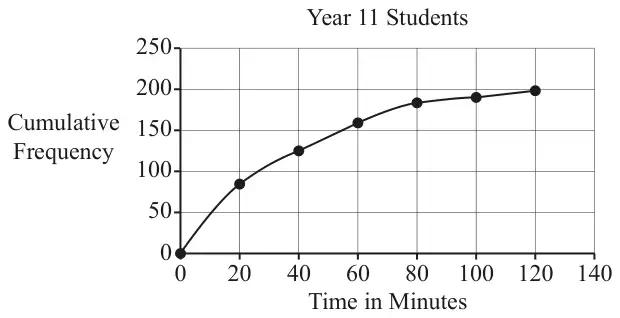
(a) Use the diagram to estimate the median time spent revising mathematics by these students. [1]
A teacher comments that 90% of the students spent less than an hour revising mathematics during this week.
(b) Determine whether the information in the diagram supports this comment. [1]
| Scheme | Marks | AO |
|---|---|---|
| \(23 \leqslant m \leqslant 29\) | B1 | 1.1 |
| [1] |
| Scheme | Marks | AO |
|---|---|---|
| no, \(p\)% spent less than an hour revising maths; or no, 90% spent less than m minutes revising maths | B1 | 2.4 |
| [1] |
Notes
B1: \(75 \leqslant p \leqslant 85\)
\(75 \leqslant m \leqslant 100\)
Allow eg \(x\) out of 200 is not 90% or 0.9 oe where \(150 \leqslant x \leqslant 170\)