
June 2022 Paper 3 Q12
12 The box plot below shows summary data for the number of minutes late that buses arrived at a rural bus stop.
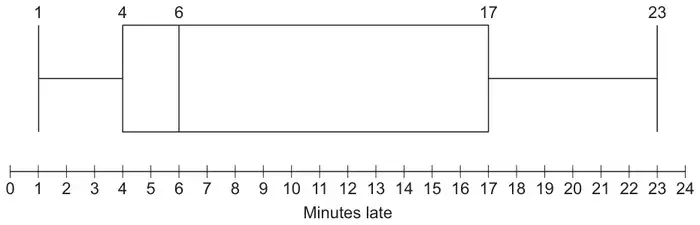
Identify which term best describes the distribution of this data.
Circle your answer. [1 mark]
- negatively skewed
- normal
- positively skewed
- symmetrical
| Scheme | Marks | AO |
|---|---|---|
| Circles correct answer | B1 | 2.2a |
| (1 mark) |
Typical solution
Positively skewed