
June 2022 Paper 2 Q15
15 A car is moving in a straight line along a horizontal road.
The graph below shows how the car’s velocity \(v\) m s−1 changes with time, \(t\) seconds.
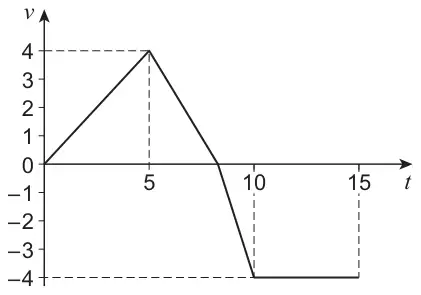
Over the period \(0 \leqslant t \leqslant 15\) the car has a total displacement of \(-7\) metres.
Initially the car has velocity 0 m s−1
Find the next time when the velocity of the car is 0 m s−1 [4 marks]
| Scheme | Marks | AO |
|---|---|---|
| Obtains a correct expression for the area of a triangle above the time axis in terms of a variable for time | B1 | 1.1b |
| Obtains a correct expression for the area of the triangle or trapezium below the time axis in terms of a variable for time accept negative area for displacement | B1 | 1.1b |
| Forms equation with a single variable using their expressions for area consistent with area above − area below = \(\pm k\) Or Forms equation with a single variable using their expressions for displacement consistent with disp above + disp below = \(k\) Where \(k\) is one of 3, 7, 13 or 17 | M1 | 3.1b |
| Obtains 8.25 seconds OE Condone missing or incorrect units | A1 | 1.1b |
| (4 marks) |
Typical solution
Let \(t\) be the next time when \(v = 0\)
\[\text{Area above} = 2t\]\[\text{Area below} = 2(10 - t) + 20\]\[2t + 7 = 2(10 - t) + 20\]\[t = 8.25 \text{ seconds}\]