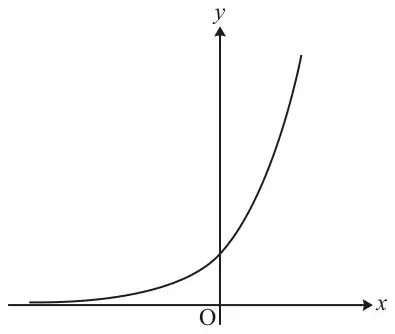
(a) The diagram shows the curve \(y = \mathrm{e}^x\).On the axes in the Printed Answer Booklet, sketch graphs of
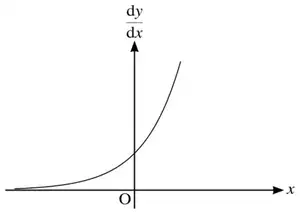
(i) \(\dfrac{\mathrm{d}y}{\mathrm{d}x}\) against \(x\), [1]
Axes printed in the Printed Answer Booklet for (a)(i)
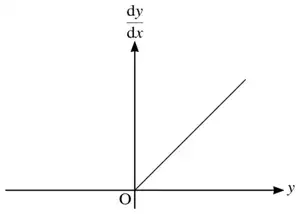
(ii) \(\dfrac{\mathrm{d}y}{\mathrm{d}x}\) against \(y\). [2]
Axes printed in the Printed Answer Booklet for (a)(ii)
(b) Wolves were introduced to Yellowstone National Park in 1995. The population of wolves, \(y\), is modelled by the equation \(y = A\mathrm{e}^{kt}\), where \(A\) and \(k\) are constants and \(t\) is the number of years after 1995.
(i) Give a reason why this model might be suitable for the population of wolves. [1]
(ii) When \(t = 0\), \(y = 21\) and when \(t = 1\), \(y = 51\). Find values of \(A\) and \(k\) consistent with the data. [3]
(iii) Give a reason why the model will not be a good predictor of wolf populations many years after 1995. [1]
Mark scheme (a)
Scheme
Marks
AO
(i)
B1
1.2
(ii)
M1 A1
2.2a 2.2a
[3]
Notes
(ii) M1: Straight line (+ve gradient) through origin (may stop short of origin)
A1: First quadrant only
Mark scheme (b)
Scheme
Marks
AO
(i) Suitable reason e.g. • Reasonable to assume population growth is proportional to population • Populations are often modelled by exponential growth
E1
3.3
[1]
(ii) \(A = 21\)
B1
3.4
\(51 = 21\mathrm{e}^k\)
M1
3.4
\(k = \ln\dfrac{51}{21} = \ln\dfrac{17}{7} \approx 0.887\) or better
A1
1.1
[3]
(iii) Suitable reason, e.g. • Population cannot keep growing • The wolves will run out of food if the population gets too big
E1
3.5b
[1]
Notes
(i) E1: Allow e.g. wolves give birth to more wolves than they started with Do not allow e.g. population is proportional to time
(ii) A1: Allow 0.89
(iii) E1: Allow e.g. lack or resources or deforestation