
October 2021 Paper 2 Q10
10 Ben has an interest in birdwatching.
For many years he has identified, at the start of the year, 32 days on which he will spend an hour counting the number of birds he sees in his garden.
He divides the year into four using the Meteorological Office definition of seasons. Each year he uses stratified sampling to identify the 32 days on which he will count the birds in his garden, drawn equally from the four seasons.
Ben’s data for 2019 are shown in the stem and leaf diagram in Fig. 10.1.
| 0 | 3 5 9 9 9 |
| 1 | 0 0 1 1 2 4 5 6 7 8 9 |
| 2 | 0 1 4 6 7 8 9 |
| 3 | 0 0 2 3 |
| 4 | 0 3 6 |
| 5 | 1 |
| 6 | 0 |
Fig. 10.1
- the median,
- the interquartile range.
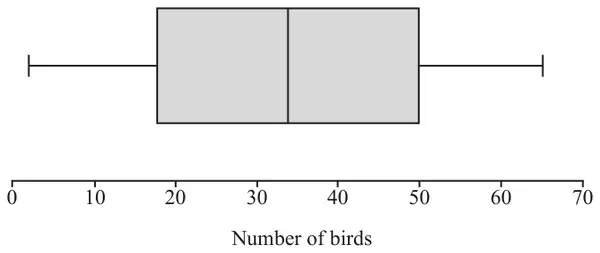
Ben found a boxplot for the sample of size 32 he collected using stratified sampling in 2015.
The boxplot is shown in Fig. 10.2.
In 2016 Ben replaced his hedge with a garden fence.
Ben now believes that
- he sees fewer birds in his garden,
- the number of birds he sees in his garden is more variable.
Jane says she can tell that the data for 2015 is definitely uniformly distributed by looking at the boxplot.
| Scheme | Marks | AO |
|---|---|---|
| to account for seasonal variation in birds oe or to account for different weather conditions which affects what birds are seen oe | B1 | 2.2b |
| [1] |
| Scheme | Marks | AO |
|---|---|---|
| positive skew cao | B1 | 1.2 |
| [1] |
| Scheme | Marks | AO |
|---|---|---|
| eg in lower quartile (or lower tail) eg much lower than median (or middle) oe eg frequency of 3 and others have frequency of 2 eg distribution is skewed (so median more appropriate) | B1 | 2.4 |
| [1] |
Notes
B1: NB mode is 9
| Scheme | Marks | AO |
|---|---|---|
| median is 19.5 | B1 | 1.1 |
| LQ is between 8th and 9th value or UQ is between 24th and 25th value soi | M1 | 1.1 |
| IQR = 30 – 11 = 19 | A1 | 1.1 |
| [3] |
Notes
M1: allow for sight of 11 or 30
| Scheme | Marks | AO |
|---|---|---|
| 2015: \(32 \leqslant\) median \(\leqslant 34\), much bigger than (their 19.5) in 2019 which supports Ben’s first statement oe | B1 | 2.2b |
| 2015: \(31 \leqslant\) IQR \(\leqslant 34\) was (much) bigger than (their 19) in 2019 which does not support Ben’s second statement oe | B1 | 2.4 |
| [2] |
Notes
if B0B0 allow SC1 for
true – median smaller in 2019 oe and
false – IQR smaller in 2019 oe
| Scheme | Marks | AO |
|---|---|---|
| eg other distributions are symmetrical (so could be eg Normal) oe eg can’t tell how values distributed in each quartile oe | B1 | 2.4 |
| [1] |