
June 2024 Paper 3 Q2
2. Amar is studying the flight of a bird from its nest.
He measures the bird’s height above the ground, \(h\) metres, at time \(t\) seconds for 10 values of \(t\)
Amar finds the equation of the regression line for the data to be \(h = 38.6 - 1.28t\)
The product moment correlation coefficient between \(h\) and \(t\) is \(-0.510\)
You should
- state your hypotheses clearly
- use a 5% level of significance
- state the critical value used
Jane draws the following scatter diagram for Amar’s data.
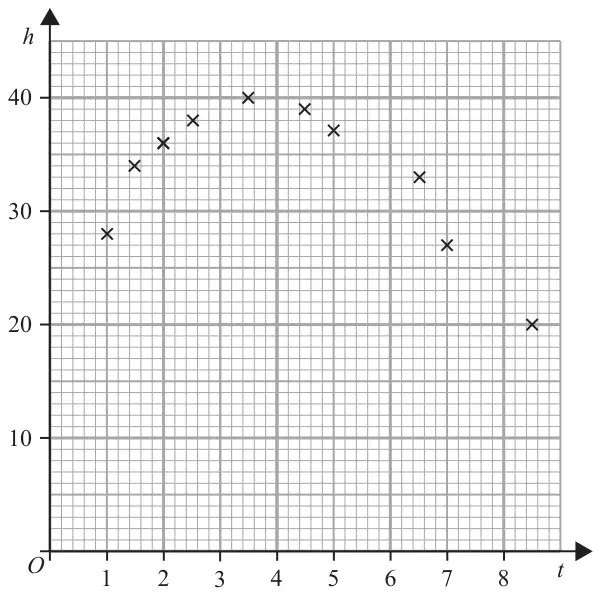
Jane suggests an improved model using the variable \(u = (t - k)^2\) where \(k\) is a constant.
She obtains the equation \(h = 38.1 - 0.78u\)
| Scheme | Marks | AO |
|---|---|---|
| e.g. The height (\(h\)) decreases by about 1.28 m for each second of the flight | B1 | 3.4 |
| (1) |
Notes
B1 for a suitable interpretation in context [value can be 1.3 or 1.28 or “just over 1”] per sec
Must have underlined words (o.e.) and units “m” or metres and “s” or seconds
NB “descends” implies “height decreases”
Condone e.g. “decreases by \(-\,1.28\) m”
| Scheme | Marks | AO |
|---|---|---|
| \(\mathrm{H_0}: \rho = 0 \qquad \mathrm{H_1}: \rho \lt 0\) | B1 | 2.5 |
| [5% 1-tail cv =] \((\pm)\ 0.5494\) | M1 | 1.1a |
| [\(r = -0.510\) not sig] there is insufficient (o.e.) evidence of a negative correlation between height (or \(\underline{h}\)) and time (or \(\underline{t}\)) | A1 | 2.2b |
| (3) |
Notes
B1 for both hypotheses correct in terms of \(\rho\) [accept a \(p\) or p but not \(r\) or r]
Must be attached to \(\mathrm{H_0}\) and \(\mathrm{H_1}\)
M1 for a critical value corresponding to their \(\mathrm{H_1}\):
1-tail: awrt \(\pm\,0.549\) or 2-tail (B0 scored for \(\mathrm{H_1}\)): awrt \(\pm\,0.632\) (tables 0.6319)
If hypotheses are in words and can deduce whether one or two-tail then use their words.
If no hypotheses or their \(\mathrm{H_1}\) is not clearly one or two-tail assume one-tail
A1 a correct conclusion in context mentioning correlation and height and time
A comparison or statement such as “not sig” is not needed but if seen must be correct.
Do NOT award this A mark if contradictory comments or working seen e.g. “reject \(\mathrm{H_0}\)” or comparison of 0.510 with significance level of 0.05 or e.g. \(-0.549 \gt -0.510\)
NB Can award B0M1A1
SC B0(for 2-tail) M0(for cv = \(\pm\,0.549\)) scored: Allow 1 mark (score as B0M0A1) for conclusion such as: “insufficient evidence of (negative) correlation between height and time of flight”
| Scheme | Marks | AO |
|---|---|---|
| No – since points seem to follow a curve/quadratic (rather than a line) or since points are “non-linear” but regression line/ model is linear or e.g. between (\(t = 5\) and 7) height drops by much more than 2.56 m or e.g. gradient is positive up to \(t = 3.5\) (line gradient \(\lt 0\)) or e.g. gradient is positive initially (line gradient \(\lt 0\)) or e.g. gradient is positive and then negative | B1 | 2.4 |
| (1) |
Notes
B1 for saying no and giving a suitable supporting reason
Don’t allow “correlation” on its own instead of “gradient”
B0 for simply saying “points don’t lie close to a straight line” Need mention of curve or some other feature of scatter plot that differs from regression line.
B0 for just “non-linear” without mention of the model being linear
B0 for simply comparing 1 or 2 points – need a comment about general pattern
| Scheme | Marks | AO |
|---|---|---|
| [\(h = 38.1 - 0.78(t - k)^2\) with] a suitable \(k\) i.e. in the range 3~4.5 | B1 | 3.3 |
| (1) | ||
| (6 marks) |
Notes
B1 for a value of \(k\) in the range [3, 4.5] Do not need \(k = \ldots\)
Accept a value embedded in Jane’s model. ISW any errors in multiplying out bracket.