
June 2024 Paper 2 Q14
14 The pre-release material contains medical data for 103 women and 97 men.
The boxplot represents the weights in kg of 101 of the women from the pre-release material.
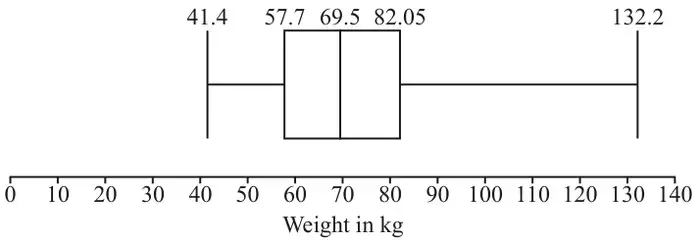
Explain what may be inferred by comparing the median weight of men with the median weight of women. [1]
Further analysis of the weights of both men and women is carried out. The table shows some of the results.
| mean | standard deviation | |
|---|---|---|
| men | 82.69 kg | 19.98 kg |
| women | 72.5 kg | 19.95 kg |
| Scheme | Marks | AO |
|---|---|---|
| not all the data were available | B1 | 2.4 |
| [1] |
Notes
B1: LDS advantage
must refer to data not being available
or reference to #N/A
| Scheme | Marks | AO |
|---|---|---|
| \(57.7 - 1.5 \times (82.05 - 57.7)\) or \(82.05 + 1.5 \times (82.05 - 57.7)\) seen | M1 | 1.1 |
| outliers \(\lt 21.175\) or outliers \(\gt 118.575\) | A1 | 2.2a |
| (hence all outliers in interval) (118.575,132.2] (since no outliers in lower tail) | A1 | 2.2a |
| [3] |
Notes
A1: given correct to 1 dp or better; both regions needed; allow non-strict inequalities
A1: allow eg between 118.6 and 132.2
allow strict or non-strict inequalities
if M0 allow SCB1 for both regions outliers \(\lt 21.175\) or outliers \(\gt 118.575\) unsupported;
allow SCB2 for all outliers in (118.575,132.2] unsupported
| Scheme | Marks | AO |
|---|---|---|
| should not be removed since no reason to eg doubt that it’s genuine data eg suspect it’s been misrecorded eg doubt since from (US) government | B1 | 2.4 |
| [1] |
Notes
B1: LDS advantage
| Scheme | Marks | AO |
|---|---|---|
| a typical man is heavier than a typical woman, [since \(79.9 \gt 69.5\)] | B1 | 2.2b |
| [1] |
Notes
B1: allow
eg an average man is heavier than an average woman
do not allow
eg men are heavier than women on average
| Scheme | Marks | AO |
|---|---|---|
| mean weight for men is greater than mean weight for women, so distribution for men is located further along the number line than the distribution for women (by about 10 kg) oe | B1 | 2.4 |
| standard deviations (or variances) are approximately equal, so similar dispersion about the mean / variation in weights for men and women oe | B1 | 2.2a |
| [2] |
Notes
B1: allow mean weight for men greater than mean weight for women, so men are heavier than women (by about 10 kg) oe
must refer to mean or average
B1: must refer to standard deviation or variance