
June 2025 Paper 2 Q11
11 Apples are sold in packets of 4. Ling and Sam are investigating the frequency, \(f\), of the number of bruised apples in a packet, \(x\). They each collect a random sample of packets, note the number of bruised apples in each packet and draw a diagram to represent their data.
Ling’s results are shown in Table 11.1 and Fig. 11.1.
Table 11.1
| \(x\) | 0 | 1 | 2 | 3 | 4 |
|---|---|---|---|---|---|
| \(f\) | 19 | 2 | 0 | 2 | 2 |
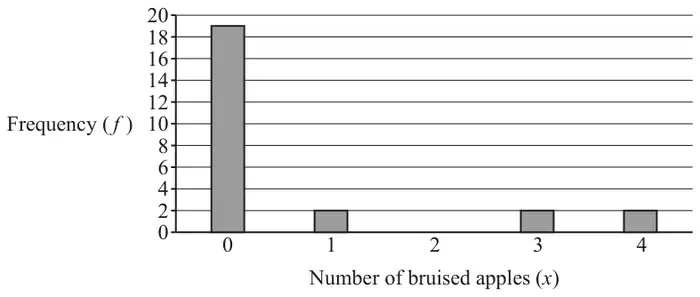
Sam’s results are shown in Table 11.2 and Fig. 11.2.
Table 11.2
| \(x\) | 0 | 1 | 2 | 3 | 4 |
|---|---|---|---|---|---|
| \(f\) | 39 | 1 | 0 | 3 | 7 |
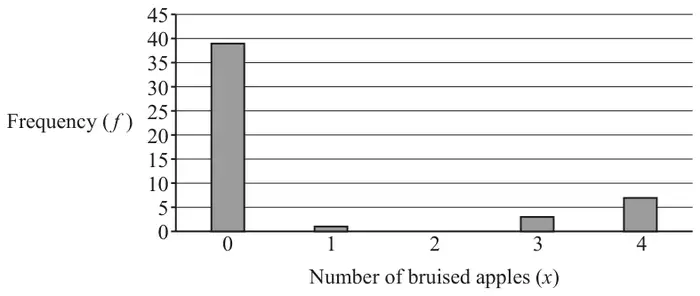
Sam thinks that the distribution of bruised apples may be modelled by a binomial distribution.
| Scheme | Marks | AO |
|---|---|---|
| because Sam used a larger sample oe | B1 | 2.4 |
| [1] |
Notes
B1: allow
eg because he/she/they used more data
eg the sample is bigger
| Scheme | Marks | AO |
|---|---|---|
| 0.76 or \(\frac{38}{50}\) oe BC | B1 | 1.1 |
| [1] |
Notes
B1: mark the final answer
| Scheme | Marks | AO |
|---|---|---|
| 0.19 | B1 | 3.3 |
| [1] |
Notes
B1: FT \(\dfrac{\text{their } 0.76}{4}\)
| Scheme | Marks | AO | ||||||||||||
|---|---|---|---|---|---|---|---|---|---|---|---|---|---|---|
| B1 B1 B1 | 3.4 3.4 1.1 | ||||||||||||
| [3] |
Notes
B1: for 1 correct frequency to 2 d.p.
B1: for 3 correct frequencies to 2 d.p.
B1: for all 5 correct to 2 d.p.
FT use of B(4, their 0.19);
allow SC2 for all 5 frequencies awrt 22, 20, 7, 1, 0 or better
allow SC1 for 3 of the above frequencies awrt nearest whole number or better
if B0B0B0 allow SC1 for probabilities: 0.430467…, 0.403895…, 0.142111…, 0.022223…, 0.001303 given to 3 dp or more; FT use of B(4, their 0.19) with \(0 \lt p \lt 1\)
| Scheme | Marks | AO |
|---|---|---|
| by comparing theoretical and observed frequencies (or probabilities), the model is a (very) poor fit oe | B1 | 3.5a |
| [1] |
Notes
B1: allow comparison of one pair of frequencies or one pair of probabilities;