
June 2025 Paper 2 Q10
10 The pre-release material contains information about life expectancy at birth for countries of the world at 10-year intervals from 1960 until 2020.
The life expectancy at birth of the population of Sudan for this period, together with a line of best fit, is shown in Fig. 10.1.
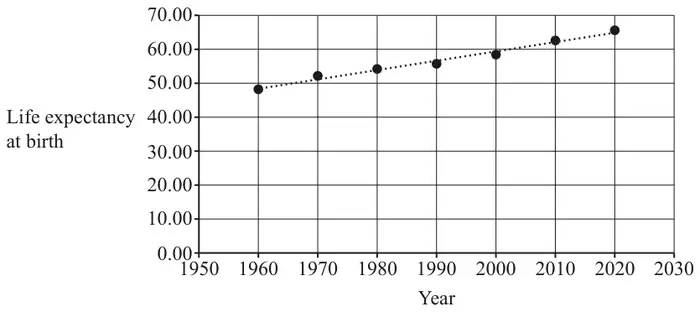
The equation of the line of best fit is \(L = 0.275X - 490\), where \(X\) is the year and \(L\) is the life expectancy at birth, measured in years.
The pre-release material also gives the median age of the population in countries of the world.
The table shows the median age of the population and the life expectancy at birth in 2020 for some countries in Africa.
| Country | Median age | Life expectancy at birth 2020 |
|---|---|---|
| Nigeria | 18.6 | 55.02 |
| Rwanda | 19.7 | 69.33 |
| Saint Helena, Ascension and Tristan da Cunha | 43.2 | #N/A |
| Sao Tome and Principe | 19.3 | 70.58 |
| Senegal | 19.4 | 68.21 |
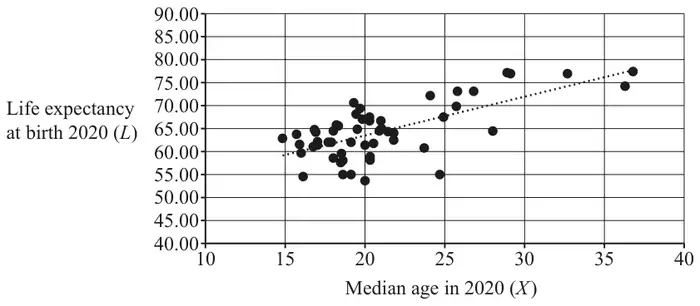
Fig. 10.2 shows a scatter diagram for the cleaned data of life expectancy at birth against median age in 2020 for the countries in Africa. It also shows a line of best fit.
The product moment correlation coefficient for these data is 0.680.
Explain whether this estimate is likely to be reliable. [1]
| Scheme | Marks | AO |
|---|---|---|
| 53.125 rounded to 2 or more sf isw | B1 | 1.1 |
| [1] |
| Scheme | Marks | AO |
|---|---|---|
| likely to be close because oe allow eg linear model seems appropriate eg interpolation eg 1975 is within range eg points are approximately in a straight line | B1 | 2.2b |
| [1] |
Notes
B1: allow eg yes
do not allow
eg 53.125 is within range
eg positive correlation
eg follows the same trend
eg the value for 1975 is between the values for 1970 and 1980
| Scheme | Marks | AO |
|---|---|---|
| not likely to be close approximation because oe eg life expectancy generally higher in UK (or Europe) oe eg life expectancy generally lower in Sudan (or Africa) oe eg change of life expectancy over time different in UK oe | B1 | 2.4 |
| [1] |
Notes
B1: must refer to life expectancy;
must refer to UK or Europe or Sudan or Africa;
ignore superfluous speculation
do not allow
eg not likely to be close because data is different
eg life expectancy varies between countries
| Scheme | Marks | AO |
|---|---|---|
| remove / delete the row with #N/A or remove (the data for) Saint Helena, (Ascension and Tristan da Cunha) isw | B1 | 1.2 |
| [1] |
Notes
B1: do not allow “cell” or “entry”
do not allow ignore instead of remove
ignore superfluous comments
| Scheme | Marks | AO |
|---|---|---|
| not reliable because oe eg it’s extrapolation eg 43.2 is outside the range of median ages eg \(r\) is not close to 1 eg scatter does not appear to be linear eg linear model is not a good fit for the data eg scatter not elliptical | B1 | 2.2b |
| [1] |
Notes
B1: do not allow
eg because it’s not linear