
C1 January 2008 Q6
6.
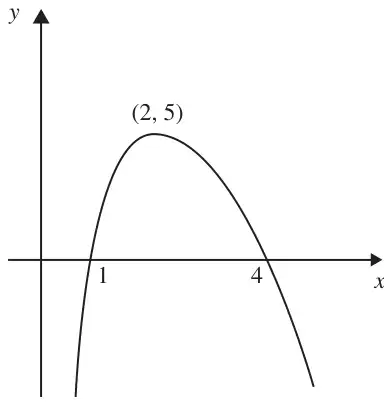
Figure 1 shows a sketch of the curve with equation \(y = \mathrm{f}(x)\). The curve crosses the \(x\)-axis at the points \((1, 0)\) and \((4, 0)\). The maximum point on the curve is \((2, 5)\).
In separate diagrams sketch the curves with the following equations.
On each diagram show clearly the coordinates of the maximum point and of each point at which the curve crosses the \(x\)-axis.
The maximum point on the curve with equation \(y = \mathrm{f}(x + a)\) is on the \(y\)-axis.
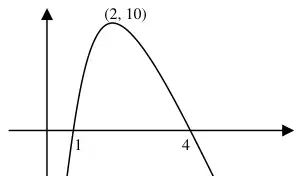
| Scheme | Marks |
|---|---|
| Shape: Max in 1st quadrant and 2 intersections on positive \(x\)-axis | B1 |
| 1 and 4 labelled (in correct place) or clearly stated as coordinates | B1 |
| (2, 10) labelled or clearly stated | B1 |
| (3) |
Notes
(a) and (b):
1st B: ‘Shape’ is generous, providing the conditions are satisfied.
2nd and 3rd B marks are dependent upon a sketch having been drawn.
2nd B marks: Allow (0, 1), etc. (coordinates the wrong way round) if the sketch is correct.
Points must be labelled correctly and be in appropriate place (e.g. (−2, 5) in the first quadrant is B0).
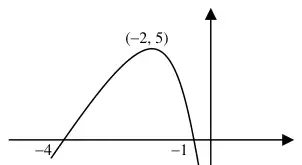
| Scheme | Marks |
|---|---|
| Shape: Max in 2nd quadrant and 2 intersections on negative \(x\)-axis | B1 |
| −1 and −4 labelled (in correct place) or clearly stated as coordinates | B1 |
| (−2, 5) labelled or clearly stated | B1 |
| (3) |
Notes
(a) and (b):
1st B: ‘Shape’ is generous, providing the conditions are satisfied.
2nd and 3rd B marks are dependent upon a sketch having been drawn.
2nd B marks: Allow (0, 1), etc. (coordinates the wrong way round) if the sketch is correct.
Points must be labelled correctly and be in appropriate place (e.g. (−2, 5) in the first quadrant is B0).
(b) Special case:
If the graph is reflected in the \(x\)-axis (instead of the \(y\)-axis), B1 B0 B0 can be scored. This requires shape and coordinates to be fully correct, i.e.
Shape:

Minimum in 4th quadrant and 2 intersections on positive \(x\)-axis,
1 and 4 labelled (in correct place) or clearly stated as coordinates,
(2, −5) labelled or clearly stated.
| Scheme | Marks |
|---|---|
| \((a =) \quad 2\) May be implicit, i.e. \(\mathrm{f}(x + 2)\) | B1 |
| Beware: The answer to part (c) may be seen on the first page. | |
| (1) | |
| (7 marks) |