
June 2025 Paper 2 Q15
15 The diagram shows part of a histogram illustrating the distribution of a variable \(x\)
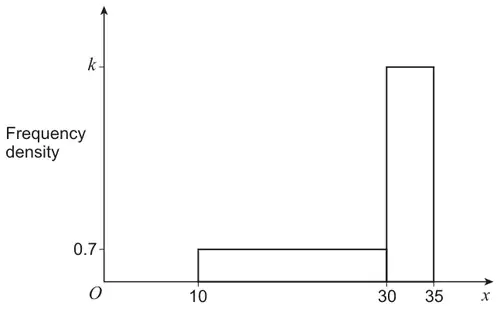
The frequency density for the class \(10 \lt x \leqslant 30\) is 0.7
The frequency density for the class \(30 \lt x \leqslant 35\) is \(k\)
The frequency for the class \(30 \lt x \leqslant 35\) is double the frequency for the class \(10 \lt x \leqslant 30\)
Find the value of \(k\) [2 marks]
| Scheme | Marks | AO |
|---|---|---|
| Uses area to obtain 14 or \(5k\) PI by 28 or \(2.5k\) | M1 | 1.1a |
| Obtains \(\dfrac{28}{5}\) ACF Do not ISW | A1 | 1.1b |
| (2 marks) |