
June 2025 Paper 2 Q17
17 The owner of a shop recorded the average daily wind speed in mph and the total sales of raincoats in pounds over a period of 6 months.
The data from a random selection of 15 days from the 6-month period is shown in the scatter diagram.
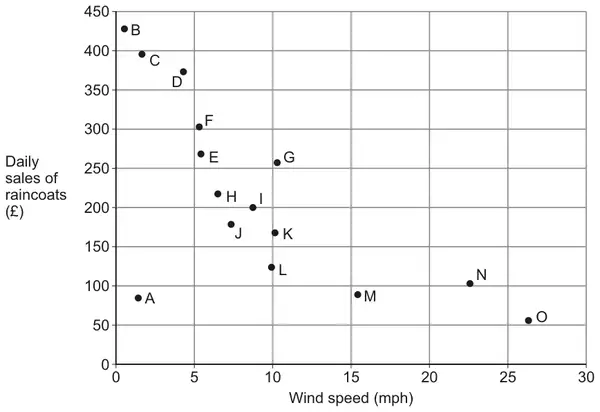
One of the points on the scatter diagram is an outlier.
(a) State the letter from the diagram which corresponds to this outlier. [1 mark]
(b) State the effect on the numerical value of the correlation coefficient if the outlier was removed from the data. [1 mark]
(c) Describe, in context, the correlation indicated by the scatter diagram. [1 mark]
(d) The owner of the shop claims that the scatter diagram proves that windier days cause lower sales of raincoats.
Comment on the validity of this claim. [1 mark]
| Scheme | Marks | AO |
|---|---|---|
| States A | B1 | 2.2a |
| (1) |
Typical solution
A
| Scheme | Marks | AO |
|---|---|---|
| Explains that the value would become more negative or strong negative OE Accept smaller/decrease | E1 | 2.4 |
| (1) |
Typical solution
The value would become more negative
| Scheme | Marks | AO |
|---|---|---|
| Describes the correlation in context. Require ‘sale(s)’ and ‘wind speed’ Do not accept ‘number’ /’amount’ Accept negative correlation (with ‘sale(s)’ and ‘wind speed’) Do not accept ‘number’/’amount’ | E1 | 2.2b |
| (1) |
Typical solution
The higher the wind speed the lower the daily sales of raincoats
| Scheme | Marks | AO |
|---|---|---|
| States claim is not valid OE, with a comment; E.g.
| E1 | 2.2b |
| (1) | ||
| (4 marks) |
Typical solution
This claim is not valid. The scatter diagram cannot prove causality, there could be another factor which is causing the fall in sales, e.g. amount of rainfall