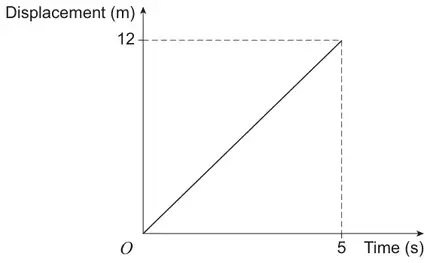
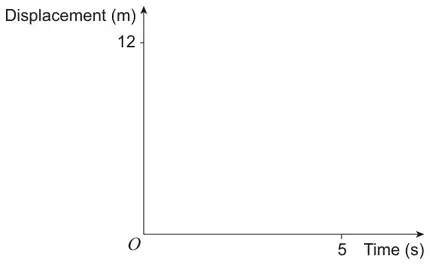
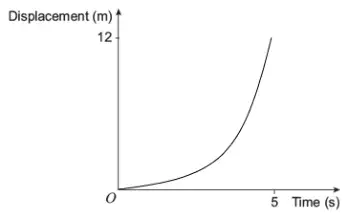
June 2025 Paper 1 Q16AQACurrent spec2 marksTime-Series Graphs16 The displacement–time graph, Figure 1, shows the first 5 seconds of the motion of a car which starts from rest and travels 12 metres.Figure 1(a) Find the speed of the car. [1 mark](b) On Figure 2, draw a more realistic displacement–time graph to show the first 5 seconds of motion of the car. [1 mark]Figure 2Mark scheme (a)Mark scheme (b)Mark scheme (a)SchemeMarksAOObtains 2.4 m s−1ACFCondone missing unitsB11.1b(1)Typical solution2.4 m s−1Mark scheme (b)SchemeMarksAODraws a graph which is convex at the origin and reaches or passes through approximately (5,12)B13.5c(1)(2 marks)Typical solution