
June 2024 Paper 2 Q11
11 The table below shows the daily salt intake, \(x\) grams, and the daily Vitamin C intake, \(y\) milligrams, for a group of 10 adults.
| Adult | A | B | C | D | E | F | G | H | I | J |
|---|---|---|---|---|---|---|---|---|---|---|
| \(x\) | 5.3 | 6.2 | 3.6 | 10.4 | 2.4 | 9.4 | 6 | 5 | 7.1 | 11.2 |
| \(y\) | 90 | 145 | 88 | 48 | 114 | 44 | 80 | 95 | 55 | 41 |
A scatter diagram of the data is shown below.
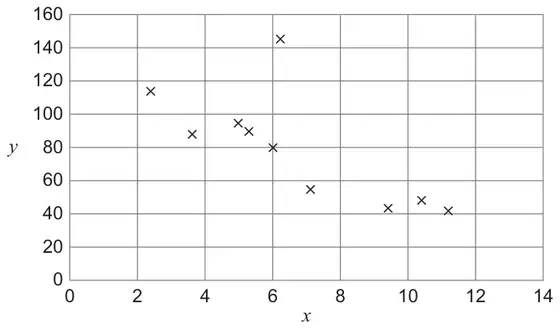
One of the adults is an outlier. Identify the letter of the adult that is the outlier.
Circle your answer below. [1 mark]
- A
- B
- E
- J
| Scheme | Marks | AO |
|---|---|---|
| Circles second answer | B1 | 2.2a |
| (1 mark) |
Typical solution
B