
June 2023 Paper 2 Q19
19 A comparison of the masses (in kg) of convertible cars was made using the Large Data Set.
A sample of 20 masses was chosen from both the 2002 data and the 2016 data.
The masses of the 20 cars in each sample were used to create a box plot for each year.
The box plots were labelled Box Plot A and Box Plot B as shown in the diagram below.
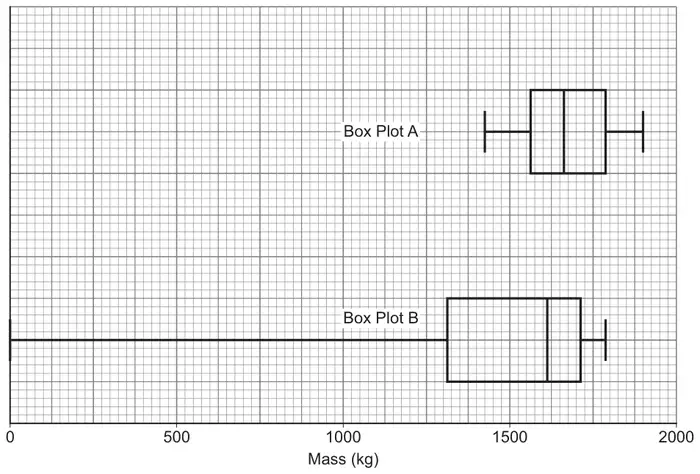
(a) Estimate the median of the masses from Box Plot A [1 mark]
(b) It is claimed that Box Plot B must be incorrectly drawn.
(i) Give a reason why this claim was made. [1 mark]
(ii) Comment on the validity of this claim. [1 mark]
(c) It is claimed that Box Plot B must be from the 2002 data. Give a reason why this claim is correct. [1 mark]
| Scheme | Marks | AO |
|---|---|---|
| Estimates median correctly AWFW 1650 to 1675 Condone missing units | B1 | 1.1b |
| (1) |
Typical solution
Median = 1662.5kg
| Scheme | Marks | AO |
|---|---|---|
| (i) Correctly identifies zero mass implied from the Box Plot Accept masses should be at least 75kg (due to inclusion of mass of driver of 75kg in data) | B1 | 2.2a |
| (1) | ||
| (ii) Argues that the claim is incorrect with the correct reason | E1 | 2.4 |
| (1) |
Typical solution
(i)
The Box Plot implies that there is at least one car of zero mass which is not possible
(ii)
There are car masses of zero in the Large Data Set
So, the claim is incorrect
| Scheme | Marks | AO |
|---|---|---|
| Explains that the 2002 data is the only one of the two data sets to contain zero masses Or Gives a valid reason for Box Plot B being from the 2002 data or for Box Plot A being from 2016. The reason must be justified from the relevant Box Plot | E1 | 2.4 |
| (1) | ||
| (4 marks) |
Typical solution
The 2002 data is the only one of the two data sets to contain zeros in the masses of cars field