June 2021 Paper 1 Q13
13 A car, initially at rest, is driven along a straight horizontal road.
The graph below is a simple model of how the car’s velocity, \(v\) metres per second, changes with respect to time, \(t\) seconds.
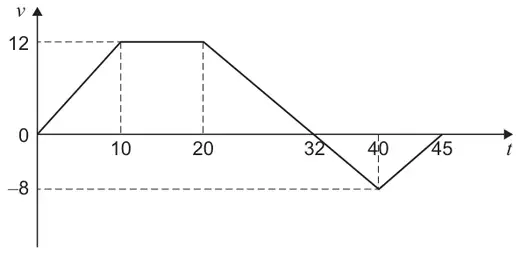
(a) Find the displacement of the car when \(t = 45\) [3 marks]
(b) Shona says:
“This model is too simple. It is unrealistic to assume that the car will instantaneously change its acceleration.”
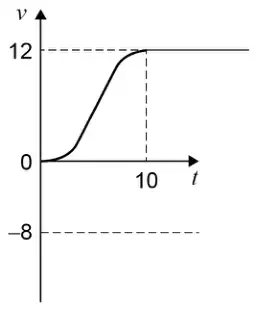
On the axes below sketch a graph, for the first 10 seconds of the journey, which would represent a more realistic model. [2 marks]
| Scheme | Marks | AO |
|---|---|---|
| Finds any area either above or below the axis | M1 | 3.1b |
| Obtains correct values of area above or area below the axis PI | A1 | 1.1b |
| Obtains correct displacement condone missing units | A1 | 1.1b |
| (3) |
Typical solution
\[\text{Area above} = \left(\frac{1}{2}\right)(12)(10 + 32) = 252\]\[\text{Area below} = \left(\frac{1}{2}\right)(13)(8) = 52\]\[r = 252 - 52 = 200\text{ m}\]| Scheme | Marks | AO |
|---|---|---|
| Sketches a curve at the end \(t = 0\) correctly | B1 | 3.5c |
| Sketches a curve at the end \(t = 10\) correctly | B1 | 3.5c |
| (2) | ||
| (5 marks) |
Typical solution