
June 2025 Paper 2 Q10
10
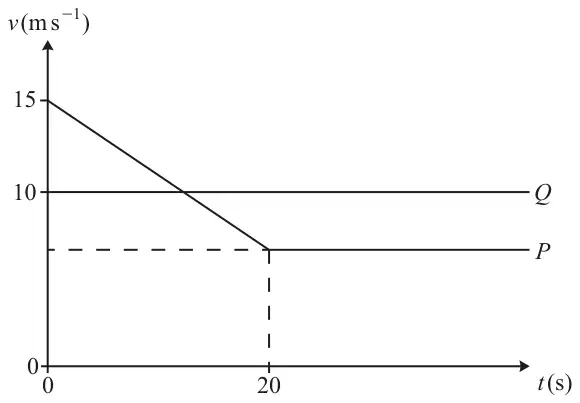
The velocity-time graph represents the motion of two cyclists \(P\) and \(Q\) who are travelling along a straight, horizontal road. At time \(t = 0\), the cyclists pass the same point on the road with \(P\) cycling at \(15\,\mathrm{m\,s^{-1}}\) and \(Q\) cycling at \(10\,\mathrm{m\,s^{-1}}\).
From time \(t = 0\), \(P\) cycles with constant deceleration \(0.4\,\mathrm{m\,s^{-2}}\) for 20 seconds and \(Q\) cycles at a constant velocity of \(10\,\mathrm{m\,s^{-1}}\). From \(t = 20\) onwards, \(P\)’s velocity remains constant.
| Scheme | Marks | AO |
|---|---|---|
| \((v_P =)\ 15 - 0.4t\) | M1 | 3.4 |
| \(15 - 0.4t = 10 \Rightarrow t = 12.5\) | A1 | 1.1 |
| [2] |
Notes
M1: Attempt to find a linear expression for the velocity of \(P\) for \(t \lt 20\) soi
Condone \(a = 0.4\)
May see \(y = 15 - 0.4x\)
A1: Condone \(x = 12.5\)
| Scheme | Marks | AO |
|---|---|---|
| Speed of \(P\) at \(t = 20\) is given by \(15 + (-0.4)(20)\) | M1 | 1.1 |
| Distance travelled by \(Q\) is given by \(10t\) | B1 | 3.4 |
| \(10t = \tfrac{1}{2}(15 + \text{‘}7\text{’})(20) + \text{‘}7\text{’}(t - 20)\) \(10t = \tfrac{1}{2}(15 - \text{‘}7\text{’})(20) + \text{‘}7\text{’}t\) \(10T + 20(10) = \text{‘}7\text{’}T + \tfrac{1}{2}(15 + \text{‘}7\text{’})(20)\) | A1FT | 3.4 |
| \(t = 26.7\) | A1 | 1.1 |
| [4] |
Notes
M1: Attempt to find speed of \(P\) at \(t = 20\)
May be seen on the diagram but needs to be seen or used in (b)
If correct speed is 7
B1: Possibly seen in subsequent working oe
Condone \(10x\)
A1FT: Correct equation with their speed of \(P\) at \(t = 20\)
Condone any inequality rather than equation here
Condone \(x\)
Where \(T\) is the time from 20s until \(Q\) overtakes \(P\)
Condone \(t\)
A1: Allow 26.7 or better (26.6666…)
Condone exact value \(\tfrac{80}{3}\) or \(26\tfrac{2}{3}\)