
June 2025 Paper 1 Q9
9 Sasha collected data from 11 students about the time they spent on computer games during the previous week and their marks in a test. The results are represented in the scatter diagram.
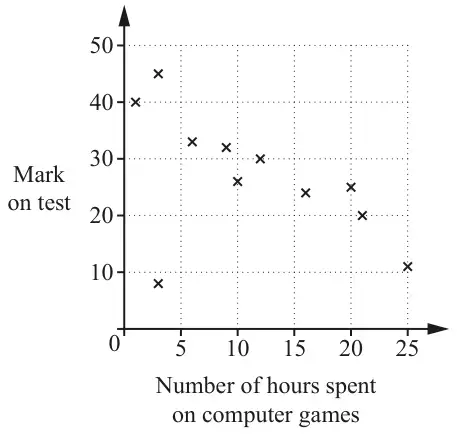
A teacher says, “The overall pattern of the points shows that, for most students, spending a long time playing computer games has a bad effect on your school work.”
A student responds, “But correlation does not imply causation.”
The teacher replies, “So why are the points in this overall pattern?”
The table shows the data that are represented in the diagram.
| Number of hours spent on computer games | 1 | 3 | 10 | 20 | 12 | 25 | 6 | 21 | 3 | 16 | 9 |
|---|---|---|---|---|---|---|---|---|---|---|---|
| Mark on test | 40 | 45 | 26 | 25 | 30 | 11 | 33 | 20 | 8 | 24 | 32 |
It is given that the quartiles of the number of hours spent on computer games are 3 and 20.
Sasha says, “The diagram shows that there is one outlier.”
| Scheme | Marks | AO |
|---|---|---|
| [Fairly good] negative correlation [between time spent on hobbies and mark in test]. | B1 | 2.2b |
| except for one point | B1 | 2.4 |
| [2] |
Notes
B1: oe e.g. ‘more hours spent on games, lower marks on test’
Condone causal implications e.g. ‘leads to’ or ‘causes’
B1: or with one outlier (condone ‘anomaly’ or ‘an outlier’)
These two distinct comments required – do not accept repetition of either
| Scheme | Marks | AO |
|---|---|---|
| There may be a third factor affecting both time spent on hobbies and marks in the test or (e.g.) “the more able students may have been away last week, so they didn’t spend much time playing computer games” | B1 | 2.4 |
| [1] |
Notes
Accept e.g.:
- ‘there may be other factors affecting both’ B1
- Any possible third factor (with example) B1
Do not accept e.g.:
- ‘not enough data’ B0
- ‘more hours gaming leads to less sleep/revision which impacts score’ B0 (suggesting causal mechanism rather than different explanation)
- ‘students are spending more time playing games than revising’ B0
| Scheme | Marks | AO |
|---|---|---|
| Median = 26 | B1 | 1.1 |
| IQR = 13 | B1 | 1.1 |
| [2] |
Notes
B1: (IQR may be seen in (d))
| Scheme | Marks | AO |
|---|---|---|
| Marks: \([33 + 1.5 \times 13 =]\ \mathbf{52.5}\) \([20 - 1.5 \times 13 =]\ 0.5\) Hours: \([20 + 1.5 \times 17 =]\ \mathbf{45.5}\) \([3 - 1.5 \times 17 =]\ -22.5\) No outliers | B1FT | 3.1a |
| [1] |
Notes
Must see use of \(1.5 \times \text{IQR}\) at least twice: sight of 52.5 (FT), and 45.5. FT IQR (for marks) and quartiles from (c)
(NB do not accept 45.5 from \(26 + 1.5 \times 13\))
B1FT: Correct conclusion FT their values.
| Scheme | Marks | AO |
|---|---|---|
| The outlier in the diagram is an outlier with regard to the correlation, not the marks or number of hours | B1FT | 2.3 |
| [1] |
Notes
B1FT: oe, FT their conclusion from (d)
e.g. if conclude in (d) that there are \(\geqslant 2\) outliers then the comment here should be ‘there is more than one outlier’ and/or ‘there are outliers, but not at this location’ because ‘they are outliers with regard to the marks or hours, not the overall correlation’
Must give an explanation, not just ‘there is not actually an outlier’
Must refer to ‘pattern’, ‘relationship’ or ‘correlation’ oe