
June 2025 Paper 1 Q10
10 Researchers investigated the change in the numbers of people in employment using underground, metro, light rail or tram (UMLRT) between 2001 and 2011.
The data are combined for those Local Authorities (LAs) with UMLRT stations into five regions: Birmingham, Liverpool, Manchester, Sheffield and Rotherham, and Tyne and Wear.
Fig. 1 shows the total numbers of people in employment in those LAs.
Fig. 2 shows the total numbers of people in employment who use UMLRT in those LAs.
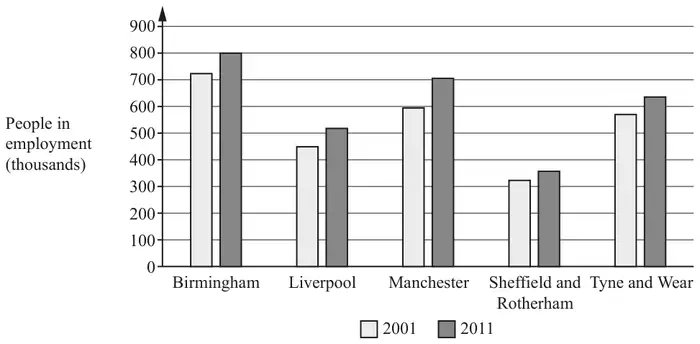
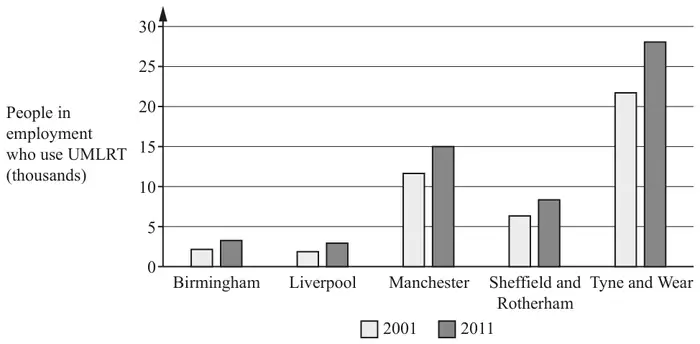
One of the researchers says, “Between 2001 and 2011, the increase in the number of people in employment who use UMLRT is greatest in Tyne and Wear.”
Sam says, “But what matters more is which region has the greatest increase in the proportion of people in employment who use UMLRT.”
Explain a disadvantage of using these data. [1]
| Scheme | Marks | AO |
|---|---|---|
| Liverpool | B1* | 2.2b |
| Smaller population but similar number of UMLRT users | B1dep* | 2.4 |
| [2] |
Notes
B1dep*: Accept e.g. ‘same numerator, smaller denominator’
Accept use of estimated values from graph e.g. comparing ~3/800 for Birmingham vs ~3/525 for Liverpool. May be rounded but must be plausible.
| Scheme | Marks | AO |
|---|---|---|
| Demands on trains and/or infrastructure are more affected by passenger numbers [than proportions, so do not agree] | B1 | 2.4 |
| [1] |
Notes
Accept valid statements in context e.g.:
- ‘what matters to planners is the number of people who are going to use the infrastructure’ B1
- ‘more people mean more public transport is needed, regardless of proportion’ B1
Do not accept generic statements about number and proportion or unrelated reasons e.g.:
- ‘small increase in number could be substantial increase in proportion’ B0
- ‘non-employees may also use UMLRT service’ B0
| Scheme | Marks | AO |
|---|---|---|
| E.g. Greater proportion means that the message is getting across | B1 | 2.2b |
| E.g. But matters more in larger areas so unclear | B1 | 2.2b |
| [2] |
Notes
Two distinct points in context from:
- ‘greater proportion of people in employment using public transport is good’
- ‘these campaigners would want the proportion of people using UMLRT to be the same or greater’
- ‘the overall population size is more important’
- ‘some areas are more suited to UMLRT than others’
- ‘No as they may wish to achieve more use of public transport overall’
- ‘Higher proportion using UMLRT means a smaller proportion using cars, which is what the group want to achieve’
| Scheme | Marks | AO |
|---|---|---|
| Those who live outside those LAs but who [nevertheless] use the system are not included. | B1 | 2.4 |
| [1] |
Notes
Oe but must be a comment about the data used (i.e. not the graphs) e.g.
- ‘The data will include everyone in an LA even if there is just one transit station [i.e. the whole population may not be served by UMLRT]’ B1
- ‘Employees may use UMLRT stations in neighbouring LAs’ B1
Do not accept generic statements e.g.:
- ‘data does not include size of each region’ B0
- unless justified in the context of the question e.g. ‘data may include people who live in an LA where there is a UMLRT station but it is very far away’ B1
- ‘LAs without UMLRT stations will not be included’ B0
- ‘LAs may not contain UMLRT stations in each region’ [misunderstanding of LA \(\subseteq\) region] B0
- ‘London not included’ B0
- ‘does not account for other public transport e.g. buses’ B0