
June 2023 Paper 1 Q10
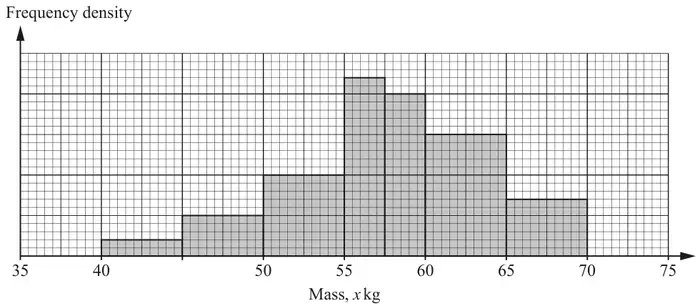
10 The masses of a random sample of 120 boulders in a certain area were recorded. The results are summarized in the histogram.
| Scheme | Marks | AO |
|---|---|---|
| eg \(120 \times \dfrac{6}{24}\) or \(120 \times \dfrac{150}{600}\) | M1 | 3.1a |
| \(= 30\) | A1 | 1.1 |
| [2] |
Notes
M1: Attempt \(120 \times \dfrac{\text{Area of 60-65 block}}{\text{Total area}}\), using any units (must see 120 used for this mark, but may be implied by ‘30’)
A1: cao
| Scheme | Marks | AO |
|---|---|---|
| (i) Attempt areas of other blocks | M1 | 1.1 |
| 57.7 (3 sf) | A1 | 2.1 |
| 6.20 (3 sf) Allow 6.2 | A1 | 1.1 |
| [3] | ||
| (ii) Distribution of masses in classes unknown | B1 | 3.2b |
| [1] |
Notes
(b)(i)
M1: May be implied by \(\bar{x} \in [55, 60]\) OR \(\sigma \in [5, 7]\) OR \(\sigma^2 \in [30, 40]\)
A1: BC
A1: BC
(b)(ii)
B1: Not just “Because midpoints used.” Or “actual masses not known” or similar.
| Scheme | Marks | AO |
|---|---|---|
| \(57.7 - 2 \times 6.20\) | M1 | 2.1 |
| \(= 45.3\) or 45, hence 4 outliers | A1ft | 2.2a |
| [2] |
Notes
M1: Attempting \(\mu \pm 2\sigma\)
A1ft: Allow 4 outliers
ft their values from (b)(i) but must be consistent
Allow ‘whole classes’ or appropriate interpolation here
(NB frequencies by class are: 4, 10, 20, 22, 20, 30, 14)
Allow 14 from the sum of the first two classes (10+4)
| Scheme | Marks | AO |
|---|---|---|
| Can obtain actual frequencies from histogram | B1 | 1.2 |
| [1] |
Notes
or similar; eg pie chart only shows relative frequencies or “histogram has figures while pie chart shows a percentage”
Acceptable answers must be specific to the question (finding actual frequencies to estimate mean/standard deviation)
Not just “show spread of data” or “easier to read” or “easier to see distribution” etc.